Building Vector Tiles from OpenStreetMap
Update: As of version 2.0, Mapbox GL JS is no longer open source. This means you will need an access token to use version 2.0 and up. See the code examples in this article for links to the previous versions.
In my previous article, I cover creating vector tiles from custom data. Which can be useful for creating visualizations from geospatial data.
But what if you wanted to host your own vector tiles for basemap (eg. the tiles that power a mapping library like Mapbox)? For that, you'd need a full planet's worth of data, just to cover all the land shapes, waterways, roads, etc.
Fortunately, there is OpenMapTiles, which is a series of tools for creating tiles from OpenStreetMap (OSM) data.
OpenMapTiles has pre-built tiles available for purchase, but all the tools used for creating the tiles are open source. You can download a free version of the full planet build, but it's about 50 GB and built uses out-of-date data (2017).
In this article, I'll walk through creating a tileset from a smaller OSM extract, and explain some of the steps along the way.
Setting up OpenMapTiles
OpenMapTiles has done a great job at dockerizing each step of the process, so as long as you have a version of docker and make installed locally, you should be able to run these scripts.
The first thing to do, is clone the repo https://github.com/openmaptiles/openmaptiles and run the default Makefile command.
git clone https://github.com/openmaptiles/openmaptiles.git
cd openmaptiles
make
This will generate the config files used to import OSM data into PostGIS database. You should now see a build/ folder in the repo, which contains a few files. You don't need to necessarily understand what each of these does, but I'll cover them here briefly.
mapping.yaml
This is the Imposm mapping file. Imposm is a library designed specifically for importing OSM data into a PostGIS database. The mapping file is how Imposm will create the database schema for importing the records from an OSM file.
sql/parallel/*.sql
There are also number of SQL files located in the build folder. Each one of these corresponds to a layer in the tile output, according to the OpenMapTiles schema. Each file describes how the data should be extracted from PostGIS when building the tiles.
Download Data
We will also need some OSM data to work with. The full OSM planet is likely going to be too big to work with (~50GB) on a single machine, and will also take a very long time to complete.
For the purposes of the demo, it will be easier to work with an OSM extract. For this, I'm going use the new-york-latest.osm.pbf from Geofabrik. Download the extract however you prefer, and place it in the data/ folder in the openmaptiles repo.
curl -o data/new-york.osm.pbf https://download.geofabrik.de/north-america/us/new-york-latest.osm.pbf
Import Data into PostGIS
Now that we have our data, there's a series of commands used for importing different types of data into the database. First though, we need to start the database.
start-db
make start-db
This will download the necessary docker images, and start a local version of PostGIS. Once done, you can verify its up and running with the pqsl command.
$ docker ps
CONTAINER ID   IMAGE                      COMMAND                  CREATED         STATUS         PORTS                     NAMES
3d8ed37e7045   openmaptiles/postgis:5.3   "docker-entrypoint.s…"   6 minutes ago   Up 6 minutes   0.0.0.0:55000->5432/tcp   openmaptiles_postgres_1

$ docker exec -it openmaptiles_postgres_1 psql -U openmaptiles

psql (9.6.20)
Type "help" for help.

openmaptiles=# \d

                 List of relations
                  Schema |       Name        | Type  |    Owner
--------+-------------------+-------+--------------
 public | country_languages | table | openmaptiles
 public | country_osm_grid  | table | openmaptiles
 public | geography_columns | view  | openmaptiles
 public | geometry_columns  | view  | openmaptiles
 public | spatial_ref_sys   | table | openmaptiles
(5 rows)

openmaptiles=# \q
import-data
make import-data
This will download a bunch of prebuilt data based on other open datasets (OpenStreetMapData, Natural Earth and OpenStreetMap Lake Labels) This data is used primarily for making up the shapes of the baselayer on the map (land-mass, oceans, etc.)
Once this command completes, you will see a lot more tables in the database.
openmaptiles=# \d

                 List of relations
Schema |                       Name                        |   Type   |    Owner
--------+---------------------------------------------------+----------+--------------
public | country_languages                                 | table    | openmaptiles
public | country_osm_grid                                  | table    | openmaptiles
public | geography_columns                                 | view     | openmaptiles
public | geometry_columns                                  | view     | openmaptiles
public | lake_centerline                                   | table    | openmaptiles
public | lake_centerline_ogc_fid_seq                       | sequence | openmaptiles
public | ne_10m_admin_0_boundary_lines_land                | table    | openmaptiles
public | ne_10m_admin_0_boundary_lines_land_ogc_fid_seq    | sequence | openmaptiles
public | ne_10m_admin_0_countries                          | table    | openmaptiles
public | ne_10m_admin_0_countries_ogc_fid_seq              | sequence | openmaptiles
public | ne_10m_admin_1_states_provinces                   | table    | openmaptiles
public | ne_10m_admin_1_states_provinces_lines             | table    | openmaptiles
public | ne_10m_admin_1_states_provinces_lines_ogc_fid_seq | sequence | openmaptiles
public | ne_10m_admin_1_states_provinces_ogc_fid_seq       | sequence | openmaptiles
public | ne_10m_antarctic_ice_shelves_polys                | table    | openmaptiles
public | ne_10m_antarctic_ice_shelves_polys_ogc_fid_seq    | sequence | openmaptiles
public | ne_10m_geography_marine_polys                     | table    | openmaptiles
import-osm
make import-osm
make import-borders
The next step is to import the OSM data we downloaded earlier. This is where Imposm comes into play, and will import the data using the mapping.yml file. There's also an additional step of creating a borders table, which will be used for creating the boundary layer (so borders can be styled independetly in the map).
This step may take a while depending on the size of the extract being used. (~30 minutes for New York on a 2018 MPB)
import-wikidata
make import-wikidata
This step will download additonal metadata based on Wikidata IDs that already exist on OSM records. This metadata can be used when styling the map (such as for displaying labels).
Generate Tiles
Now that all the data has been loaded into the database, we can generate the tiles.
Since we're working with an OSM extract here, I'm going to run the bbox step, which will clip the output to visible bounds of our data. If you're doing a full-plaent build, you can skip this step.
make generate-bbox-file
Also, remember those SQL files in the build directory I mentioned earlier? We're also going to run those now, which will create a bunch of tables and indexes used during the build phase.
make import-sql
And finally, we can run the command to generate the output tiles. Before we do though, I'm going to adjust the MAX_ZOOM variable in the .env file to 14 (from 10), just to get a bit more detail in the output map. However, doing this will increase the build time (~8hrs on my machine). Each additional zoom level will exponentially increase the time it takes to generate the tiles.
make generate-tiles
If running a high max zoom, this will take a while, but we should see some output while it runs. It will also print some stats about the output tileset once it's done.
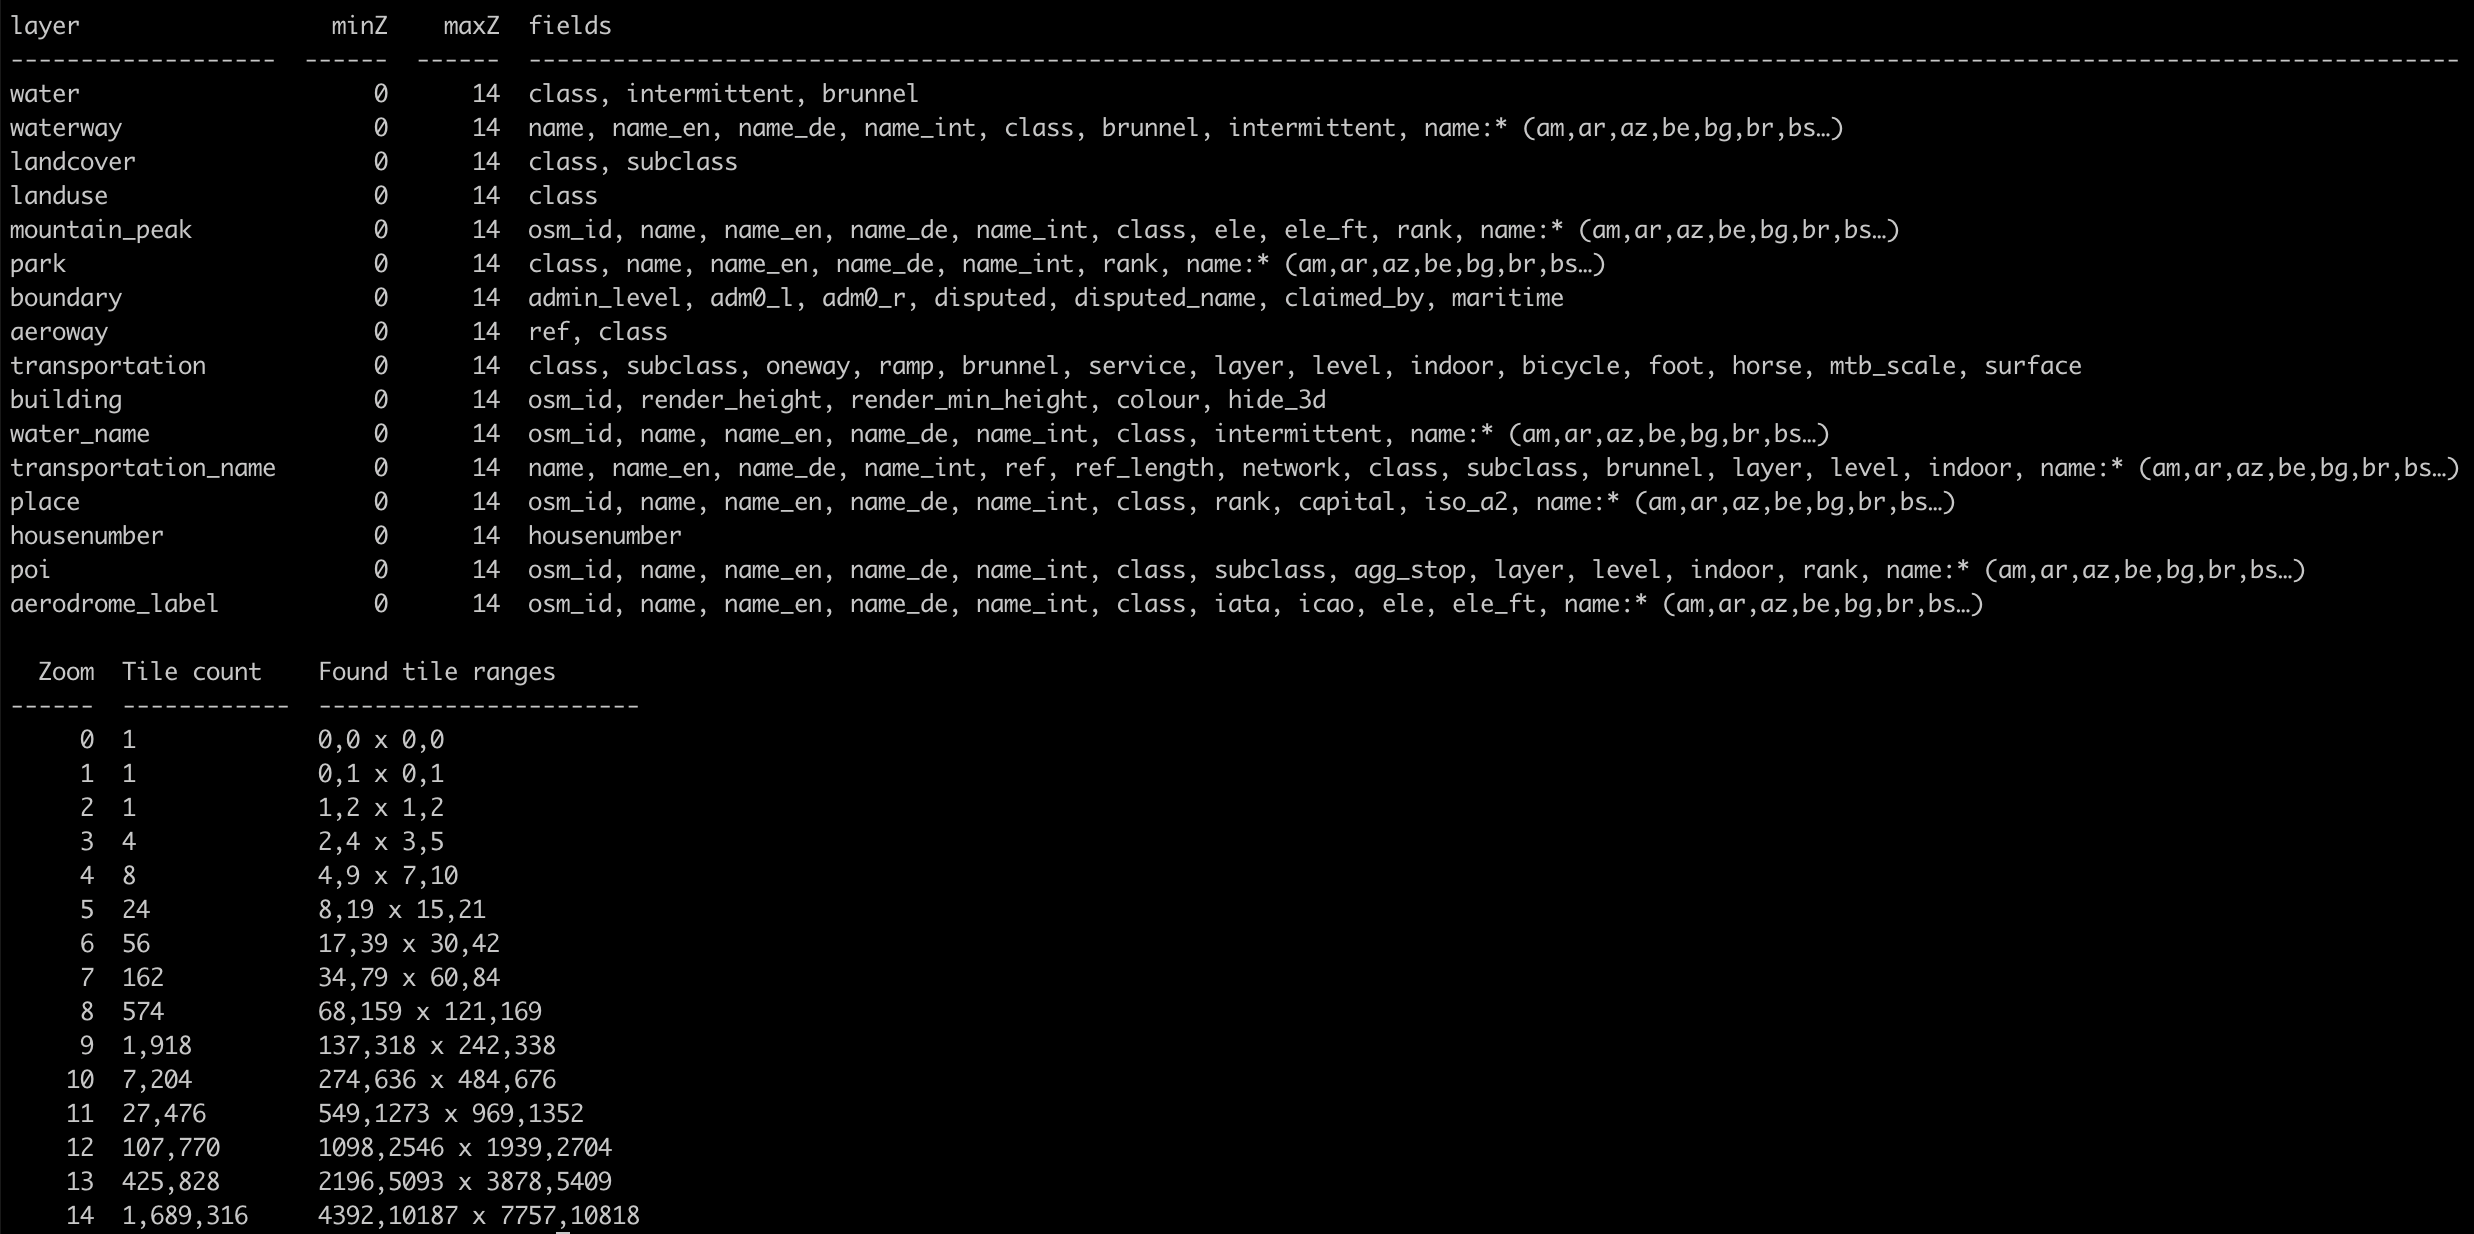
Stats about the output tileset.
There should now be a tiles.mbtiles file in our data folder.
$ du -h data/*
 12M    data/borders
4.0K    data/new-york.bbox
265M    data/new-york.osm.pbf
490M    data/tiles.mbtiles
Also as mentioned in the creating vector tiles article, .mbtiles are actually just SQLite databases, so we can do some inspecting to see what's in there.
sqlite> .tables
geocoder_data  grid_key       grids          keymap         metadata
grid_data      grid_utfgrid   images         map            tiles

sqlite> select * from metadata where name != 'json';
name        value
----------  --------------------------------------------
5.3         Pulling from openmaptiles/openmaptiles-tools
Digest      sha256:8c58c582ea683ef1b68044afcdf70865e6c79
Status      Downloaded newer image for openmaptiles/open
pixel_scal  256
mtime       1608161307939
name        OpenMapTiles
format      pbf
bounds      -83.4785061,40.0976424,-9.543467,49.873033
center      -46.5,45.0,4
minzoom     0
maxzoom     14
attributio  <a href="https://www.openmaptiles.org/" targ
descriptio  A tileset showcasing all layers in OpenMapTi
version     3.12.0
id          openmaptiles
filesize    512610304
1
2
3
4
5
6
7
8
9
10
11
12
13
14
15
16
17
18
19
20
21
22
23
24
25
26
27
28
29
30
31
32
33
34
35
36
37
38
39
40
41
42
43
44
45
46
47
48
49
50
51
52
53
54
55
56
57
58
59
60
61
62
63
64
65
66
67
68
69
70
71
72
73
74
75
76
77
78
79
80
81
82
83
84
85
86
87
88
89
90
91
92
93
94
95
96
97
98
99
100
101
102
103
104
105
106
107
108
109
110
111
112
113
114
115
116
117
118
119
120
121
122
123
124
125
126
127
128
129
130
131
132
133
134
135
136
137
138
139
140
141
142
143
144
145
146
147
148
149
150
151
152
153
154
155
156
157
158
159
160
161
162
163
164
165
166
167
168
169
170
171
172
173
174
175
176
177
178
179
180
181
182
183
184
185
186
187
188
189
190
191
192
193
194
195
196
197
198
199
200
201
202
203
204
205
206
207
208
209
210
211
212
213
214
215
216
{
  "vector_layers": [
    {
      "id": "water",
      "description": "Water polygons representing oceans and lakes. Covered watered areas are excluded (`covered=yes`).\nOn low zoom levels all water originates from Natural Earth. To get a more correct display of the south pole you should also\nstyle the covering ice shelves over the water.\nOn higher zoom levels water polygons from [OpenStreetMapData](http://osmdata.openstreetmap.de/) are used.\nThe polygons are split into many smaller polygons to improve rendering performance.\nThis however can lead to less rendering options in clients since these boundaries show up. So you might not be\nable to use border styling for ocean water features.",
      "minzoom": 0,
      "maxzoom": 14,
      "fields": {
        "class": "String",
        "intermittent": "Number",
        "brunnel": "String"
      }
    },
    {
      "id": "waterway",
      "description": "OpenStreetMap [waterways](https://wiki.openstreetmap.org/wiki/Waterways) for higher zoom levels (z9 and more)\nand Natural Earth rivers and lake centerlines for low zoom levels (z3 - z8).\nLinestrings without a name or which are too short are filtered\nout at low zoom levels.\nTill z11 there is `river` class only, in z12 there is also `canal` generated,\nstarting z13 there is no generalization according to `class` field applied.\nWaterways do not have a `subclass` field.",
      "minzoom": 0,
      "maxzoom": 14,
      "fields": {
        "name": "String",
        "class": "String",
        "brunnel": "String",
        "intermittent": "Number"
      }
    },
    {
      "id": "landcover",
      "description": "Landcover is used to describe the physical material at the surface of the earth. At lower zoom levels this is\nfrom Natural Earth data for glaciers and ice shelves and at higher zoom levels the landcover is [implied by OSM tags](http://wiki.openstreetmap.org/wiki/Landcover). The most common use case for this layer\n  is to style wood (`class=wood`) and grass (`class=grass`) areas.",
      "minzoom": 0,
      "maxzoom": 14,
      "fields": {
        "class": "String",
        "subclass": "String"
      }
    },
    {
      "id": "landuse",
      "description": "Landuse is used to describe use of land by humans. At lower zoom levels this is\nfrom Natural Earth data for residential (urban) areas and at higher zoom levels mostly OSM `landuse` tags.",
      "minzoom": 0,
      "maxzoom": 14,
      "fields": {
        "class": "String"
      }
    },
    {
      "id": "mountain_peak",
      "description": "[Natural peaks](http://wiki.openstreetmap.org/wiki/Tag:natural%3Dpeak)",
      "minzoom": 0,
      "maxzoom": 14,
      "fields": {
        "osm_id": "Number",
        "name": "String",
        "class": "String",
        "ele": "Number",
        "ele_ft": "Number",
        "rank": "Number"
      }
    },
    {
      "id": "park",
      "description": "The park layer contains parks from OpenStreetMap tagged with\n[`boundary=national_park`](http://wiki.openstreetmap.org/wiki/Tag:boundary%3Dnational_park),\n[`boundary=protected_area`](http://wiki.openstreetmap.org/wiki/Tag:boundary%3Dprotected_area),\nor [`leisure=nature_reserve`](http://wiki.openstreetmap.org/wiki/Tag:leisure%3Dnature_reserve).",
      "minzoom": 0,
      "maxzoom": 14,
      "fields": {
        "class": "String",
        "name": "String",
        "rank": "Number"
      }
    },
    {
      "id": "boundary",
      "description": "Contains administrative boundaries as linestrings.\nUntil z4 [Natural Earth data](http://www.naturalearthdata.com/downloads/) is used after which\nOSM boundaries ([`boundary=administrative`](http://wiki.openstreetmap.org/wiki/Tag:boundary%3Dadministrative))\nare present from z5 to z14 (also for maritime boundaries with `admin_level <= 2` at z4).\nOSM data contains several [`admin_level`](http://wiki.openstreetmap.org/wiki/Tag:boundary%3Dadministrative#admin_level)\nbut for most styles it makes sense to just style `admin_level=2` and `admin_level=4`.",
      "minzoom": 0,
      "maxzoom": 14,
      "fields": {
        "admin_level": "Number",
        "adm0_l": "String",
        "adm0_r": "String",
        "disputed": "Number",
        "disputed_name": "String",
        "claimed_by": "String",
        "maritime": "Number"
      }
    },
    {
      "id": "aeroway",
      "description": "Aeroway polygons based of OpenStreetMap [aeroways](http://wiki.openstreetmap.org/wiki/Aeroways).\nAirport buildings are contained in the **building** layer but all\nother airport related polygons can be found in the **aeroway** layer.",
      "minzoom": 0,
      "maxzoom": 14,
      "fields": {
        "ref": "String",
        "class": "String"
      }
    },
    {
      "id": "transportation",
      "description": "**transportation** contains roads, railways, aerial ways, and shipping\n lines.\nThis layer is directly derived from the OSM road hierarchy.\nAt lower zoom levels major highways from Natural Earth are used.\nIt contains all roads from motorways to primary, secondary and\ntertiary roads to residential roads and\nfoot paths. Styling the roads is the most essential part of the map.\nThe `transportation` layer also contains polygons for features like plazas.",
      "minzoom": 0,
      "maxzoom": 14,
      "fields": {
        "class": "String",
        "subclass": "String",
        "oneway": "Number",
        "ramp": "Number",
        "brunnel": "String",
        "service": "String",
        "layer": "Number",
        "level": "Number",
        "indoor": "Number",
        "bicycle": "String",
        "foot": "String",
        "horse": "String",
        "mtb_scale": "String",
        "surface": "String"
      }
    },
    {
      "id": "building",
      "description": "All [OSM Buildings](http://wiki.openstreetmap.org/wiki/Buildings). All building tags are imported ([`building=*`](http://wiki.openstreetmap.org/wiki/Key:building)). The buildings are not yet ready for 3D rendering support and any help to improve\nthis is welcomed.",
      "minzoom": 0,
      "maxzoom": 14,
      "fields": {
        "osm_id": "Number",
        "render_height": "Number",
        "render_min_height": "Number",
        "colour": "String",
        "hide_3d": "Boolean"
      }
    },
    {
      "id": "water_name",
      "description": "Lake center lines for labelling lake bodies.\nThis is based of the [osm-lakelines](https://github.com/lukasmartinelli/osm-lakelines) project\nwhich derives nice centerlines from OSM water bodies. Only the most important lakes contain labels.",
      "minzoom": 0,
      "maxzoom": 14,
      "fields": {
        "osm_id": "Number",
        "name": "String",
        "class": "String",
        "intermittent": "Number"
      }
    },
    {
      "id": "transportation_name",
      "description": "This is the layer for labelling the highways. Only highways that are named `name=*` and are long enough\nto place text upon appear. The OSM roads are stitched together if they contain the same name\nto have better label placement than having many small linestrings.\nFor motorways you should use the `ref` field to label them while for other roads you should use `name`.",
      "minzoom": 0,
      "maxzoom": 14,
      "fields": {
        "name": "String",
        "ref": "String",
        "ref_length": "Number",
        "network": "String",
        "class": "String",
        "subclass": "String",
        "brunnel": "String",
        "layer": "Number",
        "level": "Number",
        "indoor": "Number"
      }
    },
    {
      "id": "place",
      "description": "The place layer consists out of [countries](http://wiki.openstreetmap.org/wiki/Tag:place%3Dcountry),\n[states](http://wiki.openstreetmap.org/wiki/Tag:place%3Dstate) and [cities](http://wiki.openstreetmap.org/wiki/Key:place).\nApart from the roads this is also one of the more important layers to create a beautiful map.\nWe suggest you use different font styles and sizes to create a text hierarchy.",
      "minzoom": 0,
      "maxzoom": 14,
      "fields": {
        "osm_id": "Number",
        "name": "String",
        "class": "String",
        "rank": "Number",
        "capital": "Number",
        "iso_a2": "String"
      }
    },
    {
      "id": "housenumber",
      "description": "Everything in OpenStreetMap which contains a `addr:housenumber` tag useful for labelling housenumbers on a map.\nThis adds significant size to *z14*. For buildings the centroid of the building is used as housenumber.",
      "minzoom": 0,
      "maxzoom": 14,
      "fields": {
        "housenumber": "String"
      }
    },
    {
      "id": "poi",
      "description": "[Points of interests](http://wiki.openstreetmap.org/wiki/Points_of_interest) containing\na of a variety of OpenStreetMap tags. Mostly contains amenities, sport, shop and tourist POIs.",
      "minzoom": 0,
      "maxzoom": 14,
      "fields": {
        "osm_id": "Number",
        "name": "String",
        "class": "String",
        "subclass": "String",
        "agg_stop": "Number",
        "layer": "Number",
        "level": "Number",
        "indoor": "Number",
        "rank": "Number"
      }
    },
    {
      "id": "aerodrome_label",
      "description": "[Aerodrome labels](http://wiki.openstreetmap.org/wiki/Tag:aeroway%3Daerodrome)",
      "minzoom": 0,
      "maxzoom": 14,
      "fields": {
        "osm_id": "Number",
        "name": "String",
        "class": "String",
        "iata": "String",
        "icao": "String",
        "ele": "Number",
        "ele_ft": "Number"
      }
    }
  ]
}
Create a MBTiles Server
Now that we have a tileset, we're going to need something that can serve them. We can create a custom server that uses the .mbtiles we created, but that's probably unnecessary if you just want to make the tiles available.
OpenMapTiles supports tileserver-gl, which will turn a .mbtiles file into a tileserver, and also provides some default styles when using builds from OpenMapTiles.
The easiest way to start run the server, is to use provided docker image. Just run the following command from the same folder as the built .mbtiles file.
$ cd data/ # folder with .mbtiles

$ docker run --rm -it -v $(pwd):/data -p 8080:80 maptiler/tileserver-gl
Starting tileserver-gl v3.1.1
No MBTiles specified, using tiles.mbtiles
[INFO] Automatically creating config file for tiles.mbtiles
[INFO] Only a basic preview style will be used.
[INFO] See documentation to learn how to create config.json file.
Run with --verbose to see the config file here.
Starting server
Listening at http://[::]:80/
Startup complete
Once the server is running (at http://localhost:8080), you will see a screen that has two option for viewing the data.
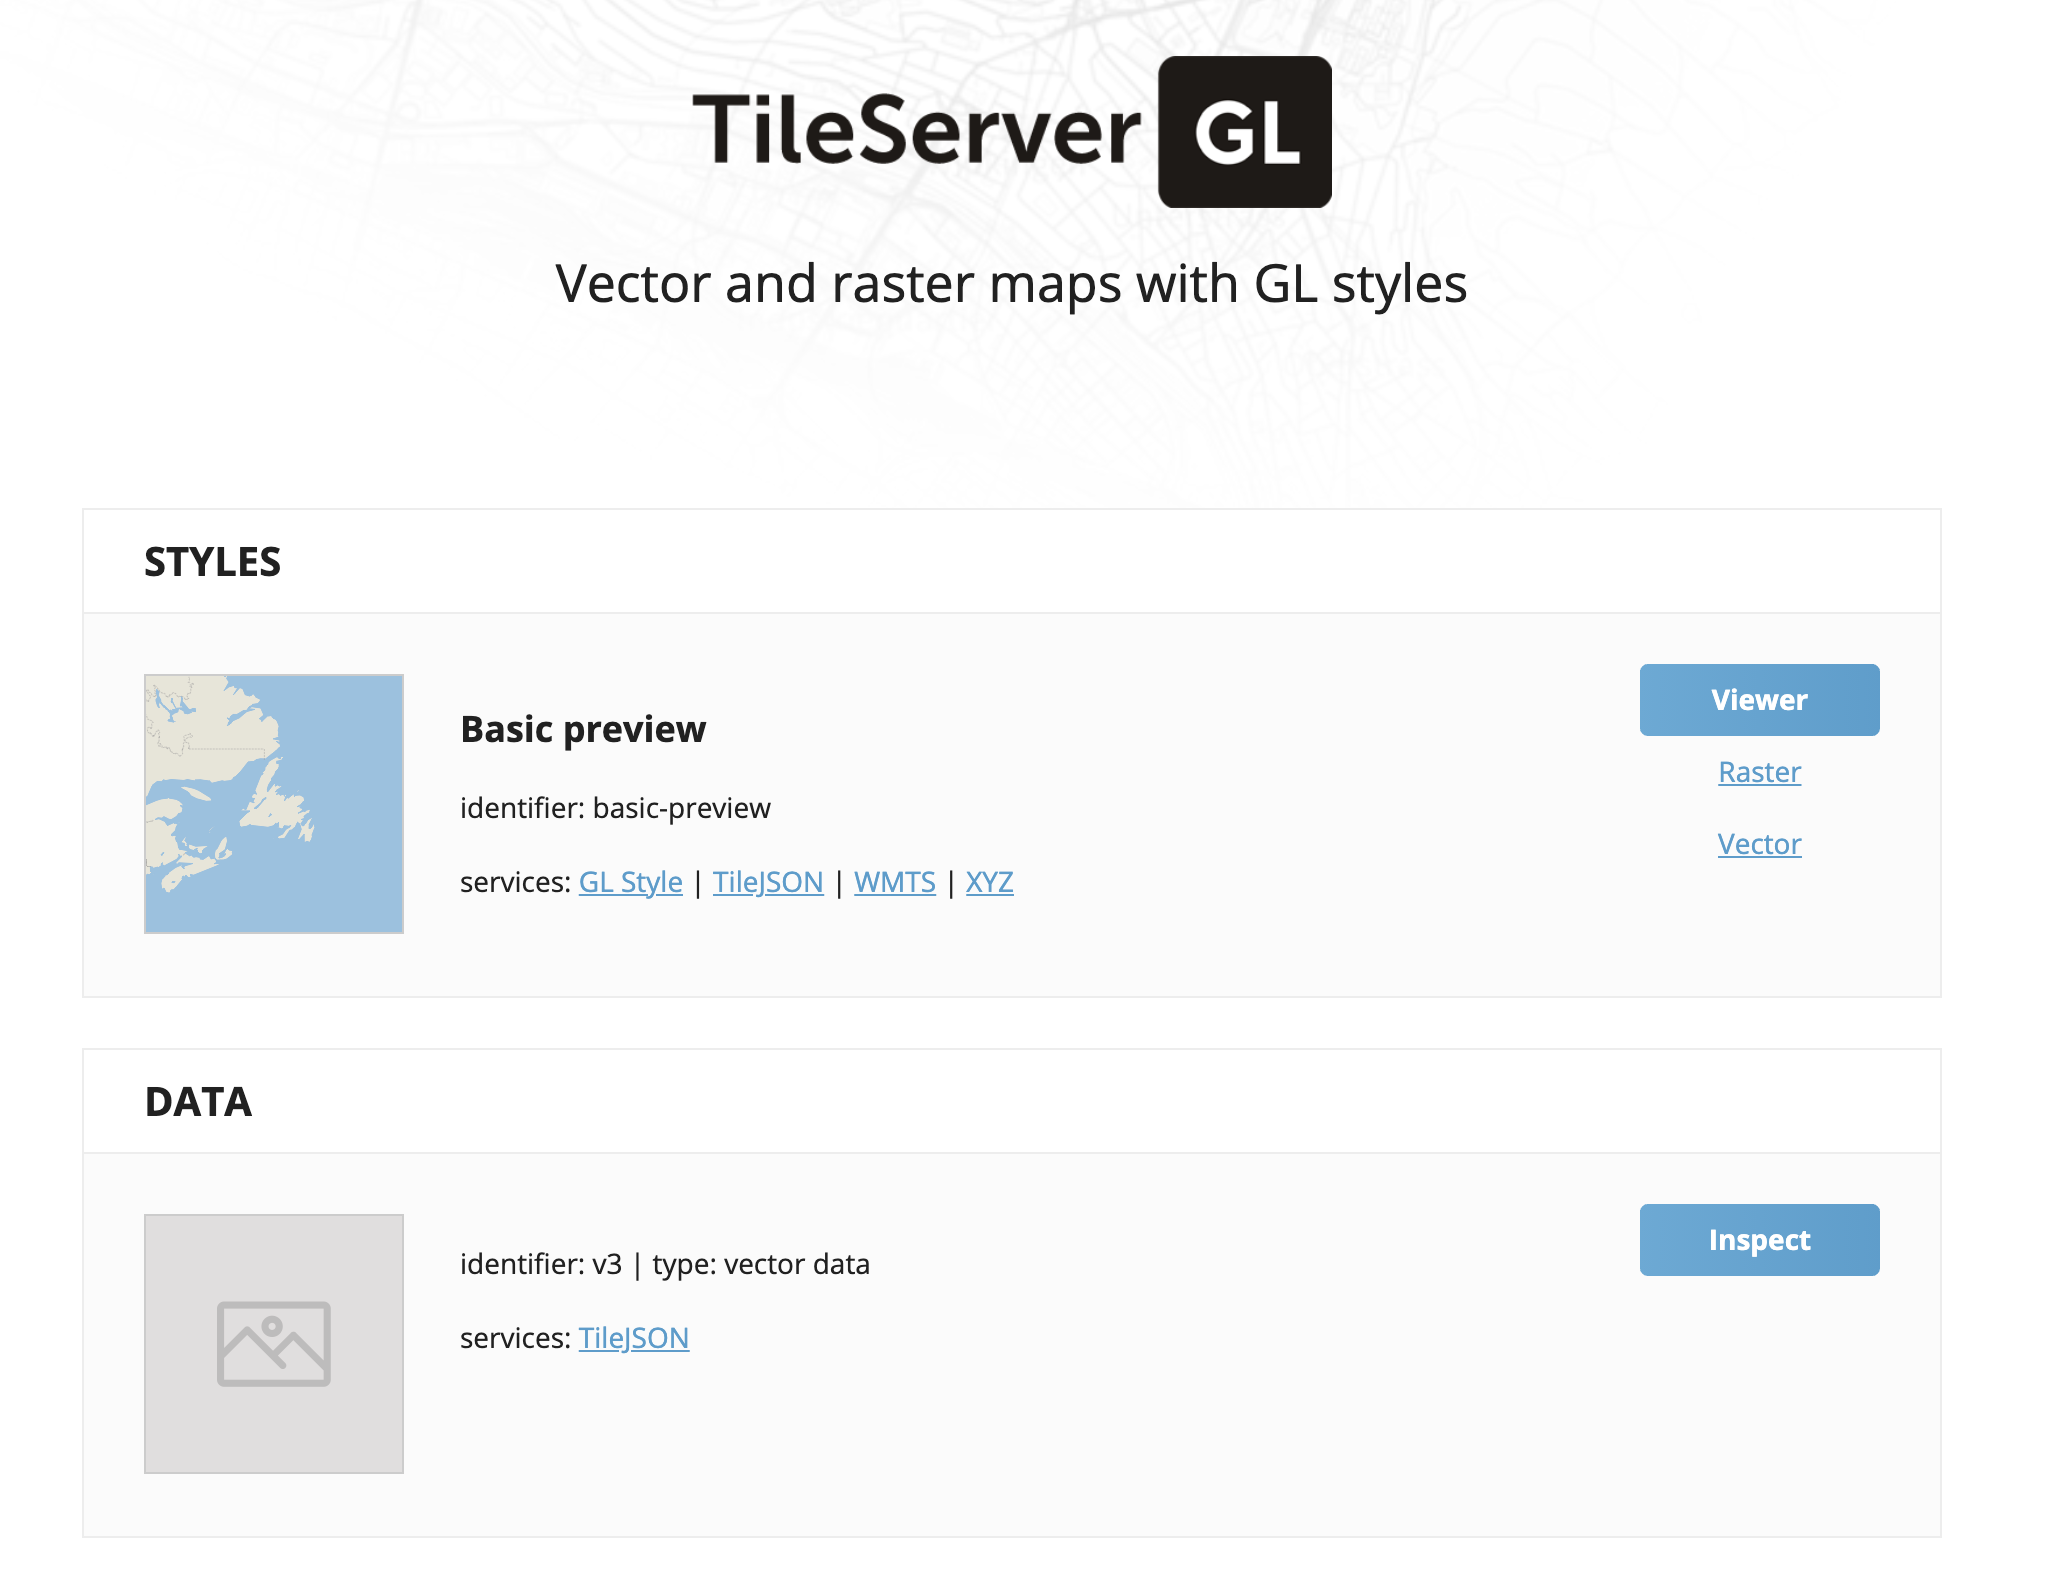
Index page for tileserver-gl.
You can view the tiles using the default styles provided by tileserver-gl (Basic Preview) or explore the data with a custom map view that highlights all the available layers in the bulid (note: the data view is only availbile for .mbtiles that were built using OpenMapTiles).
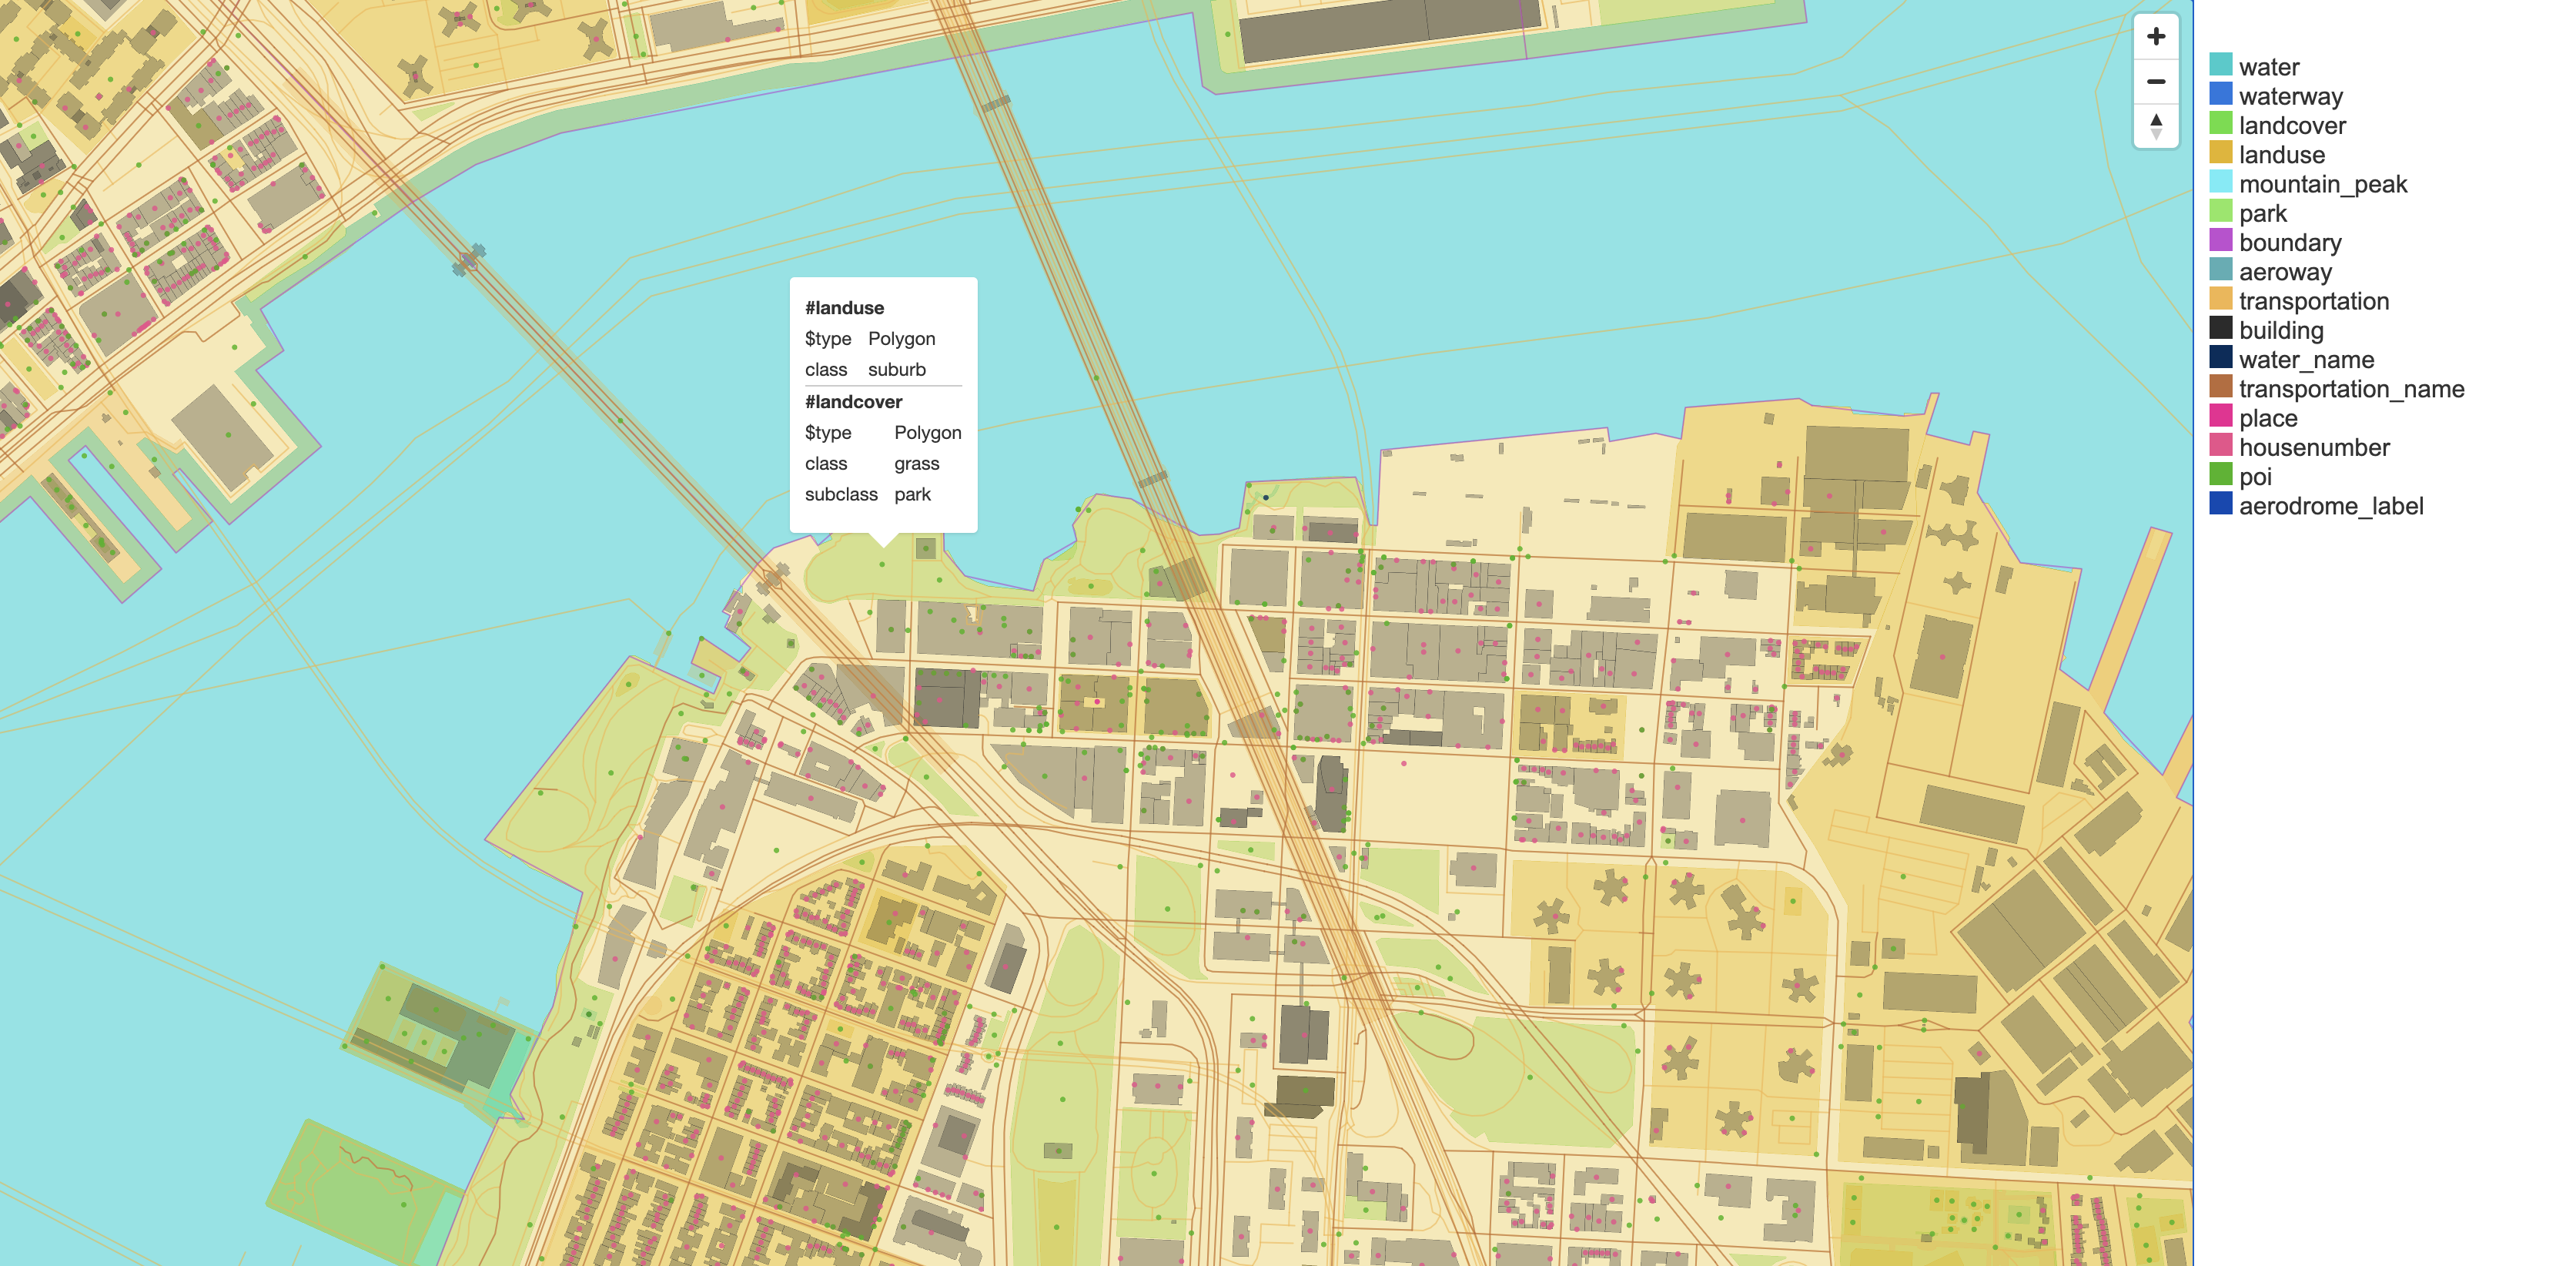
The data view using layers from OpenMapTiles.
I have a hosted version of free full-planet bulid you can demo at https://maps.ckochis.com.
Using Tiles in a Map
The most common use for the tiles will be displaying them in a map. Since our tiles are using the Mapbox Vector Tile spec, we can render the map using Mapbox GL JS.
The Mapbox GL client and the vector tile specs are open source, so we can use Mapbox technology without needed an account, as long as we're hosting our own tiles. The OpenMapTiles build also contains a Mapbox style sepc, as well as a TileJSON schema, so we can do a pretty simple one-line swap to get Mapbox GL JS to use our tileset.
We can follow the display a map example from Mapbox, but change the "style" property to use the style from our tile server instead. So change the line
style: 'mapbox://styles/mapbox/streets-v11', // style URLTo use the style spec from tileserver-gl (see the GL Style link from the tileserver-gl homepage)
style: 'http://localhost:8080/styles/basic-preview/style.json', // style URLSo the map code we have looks like (you can omit the access token!)
var map = new mapboxgl.Map({
  container: 'map', // container id
  style: 'mapbox://styles/mapbox/streets-v11', // style URL
  center: [-74.5, 40], // starting position [lng, lat]
  zoom: 9 // starting zoom
});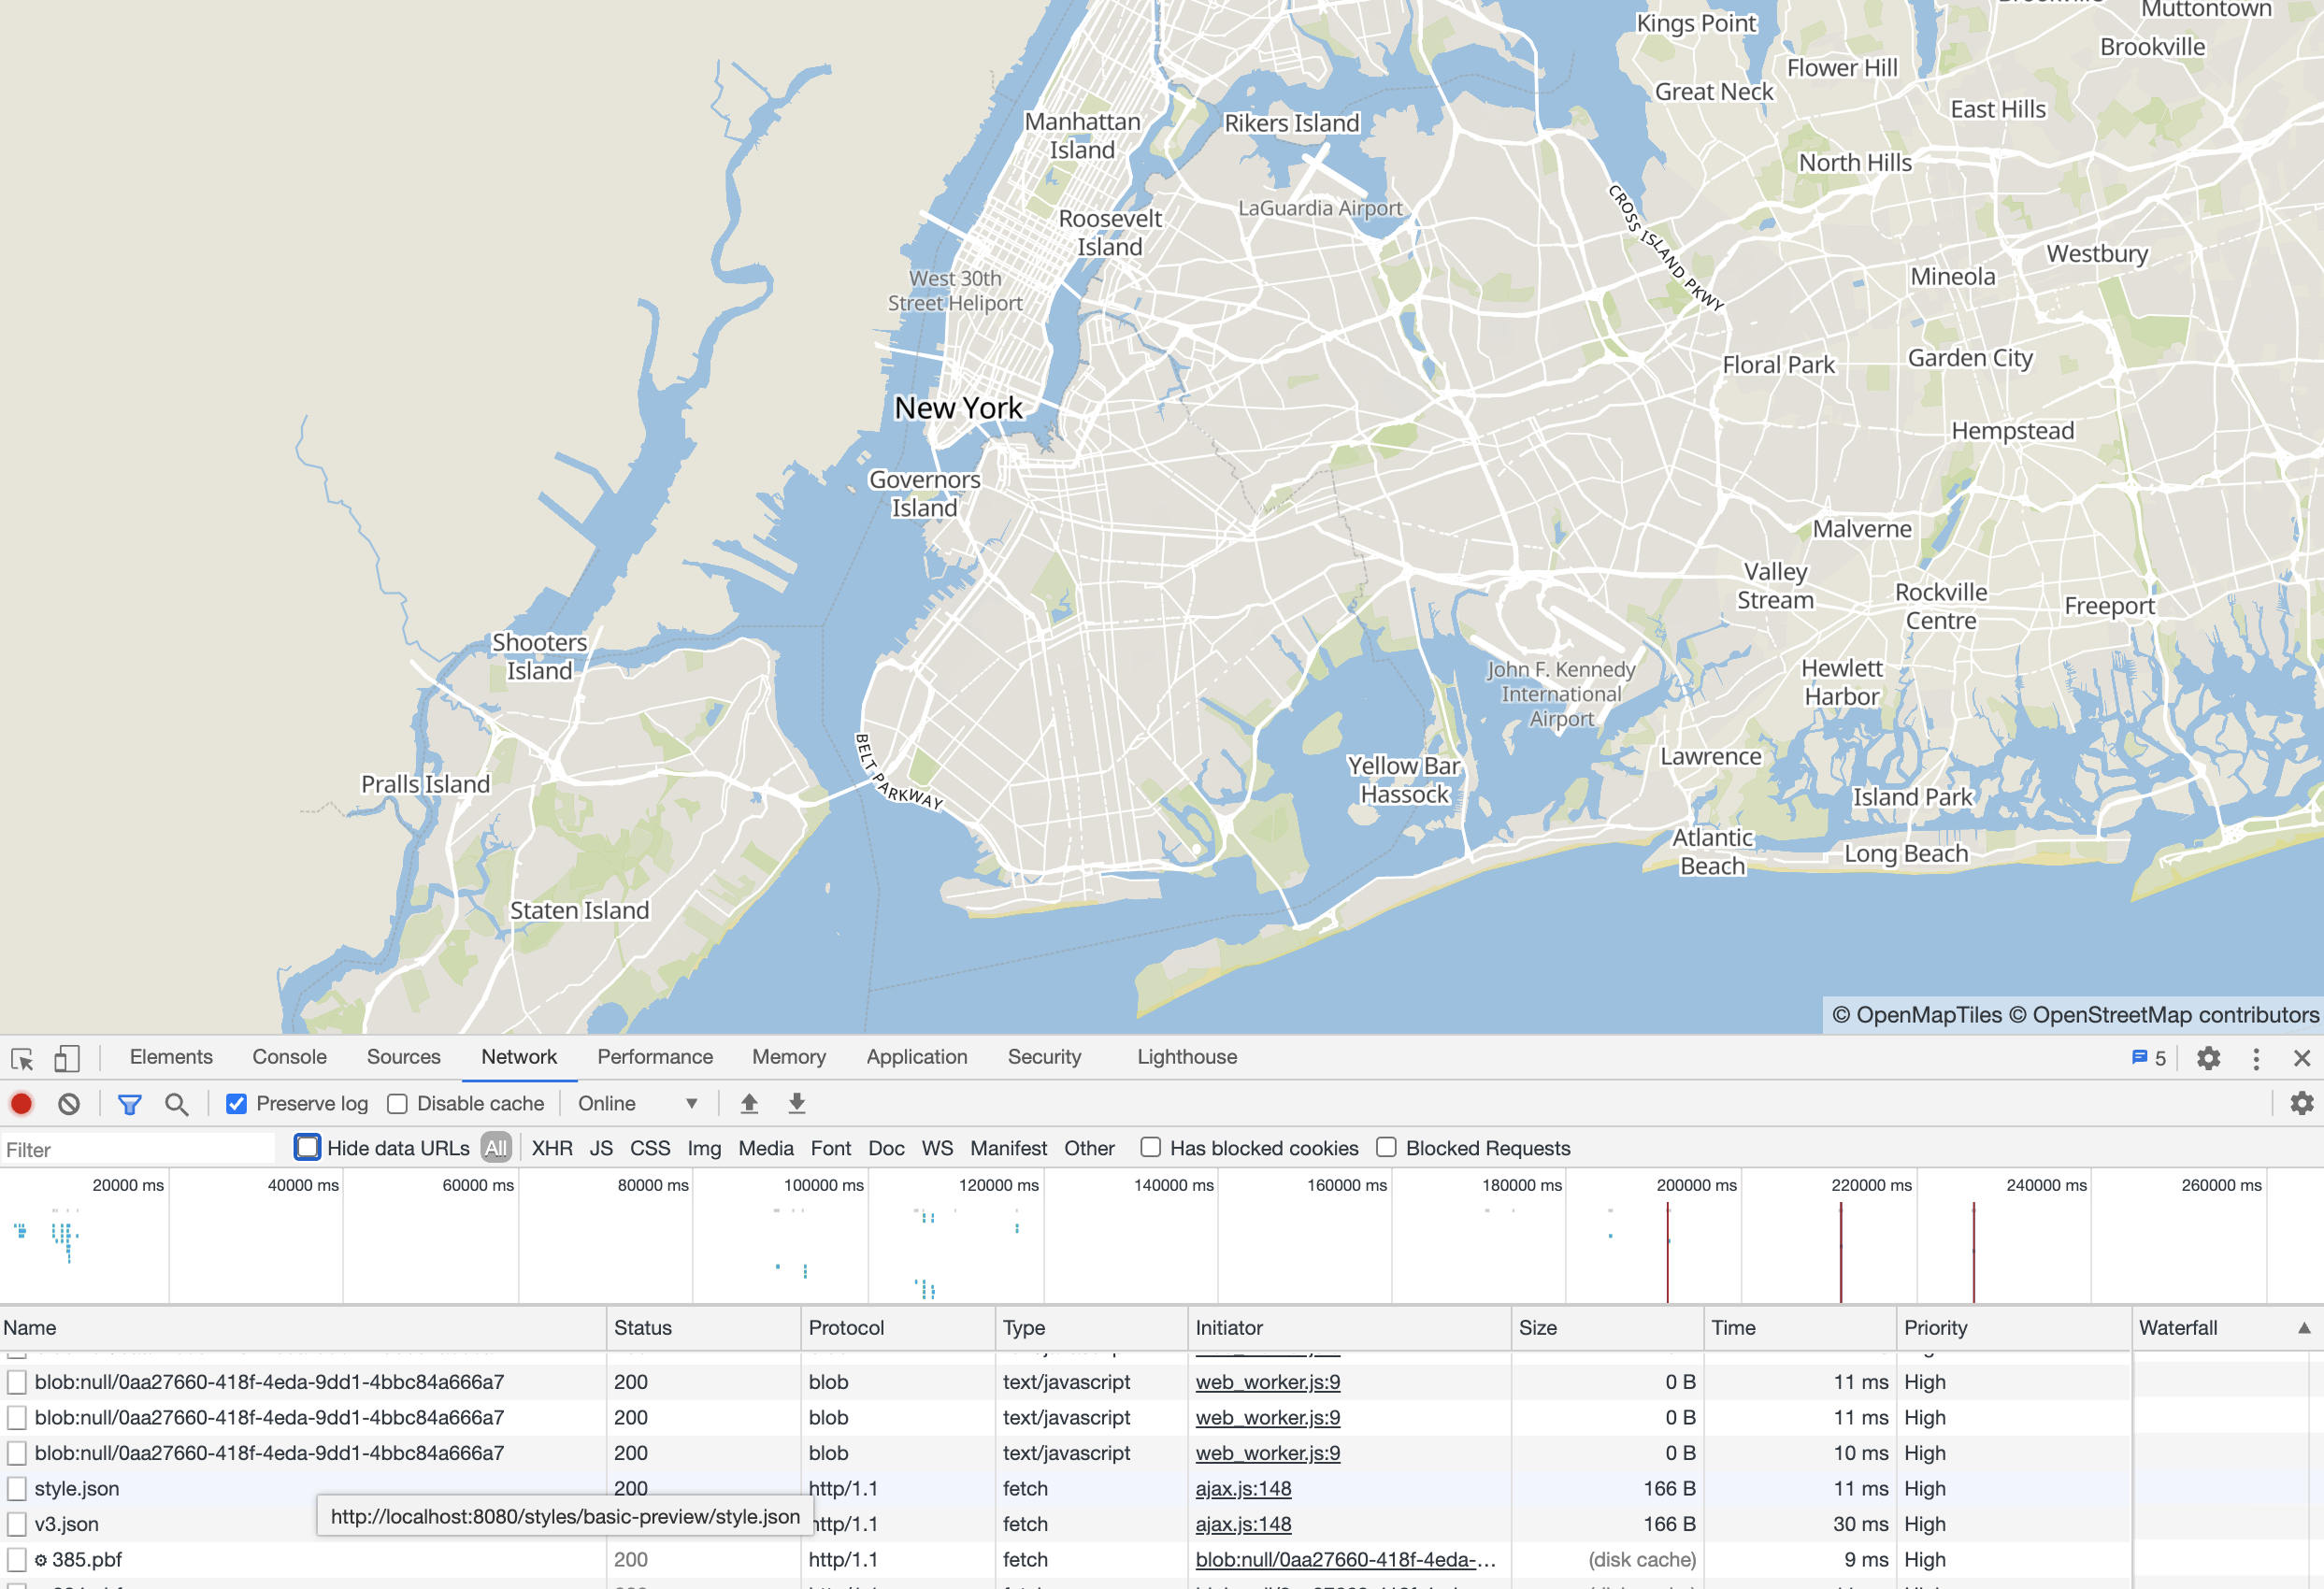
Custom OSM tiles being rendered with Mapbox GL JS
1
2
3
4
5
6
7
8
9
10
11
12
13
14
15
16
17
18
19
20
21
22
23
24
25
<!DOCTYPE html>
<html>
  <head>
    <meta charset="utf-8" />
    <title>Display a map</title>
    <meta name="viewport" content="initial-scale=1,maximum-scale=1,user-scalable=no" />
    <script src="https://api.mapbox.com/mapbox-gl-js/v1.12.0/mapbox-gl.js"></script>
    <link href="https://api.mapbox.com/mapbox-gl-js/v1.12.0/mapbox-gl.css" rel="stylesheet" />
    <style>
      body { margin: 0; padding: 0; }
      #map { position: absolute; top: 0; bottom: 0; width: 100%; }
    </style>
  </head>
  <body>
    <div id="map"></div>
    <script>
      var map = new mapboxgl.Map({
        container: 'map', // container id
        style: 'http://localhost:8080/styles/basic-preview/style.json', // style URL
        center: [-73.93123031616307, 40.682175616084066], // starting position [lng, lat]
        zoom: 10 // starting zoom
      });
    </script>
  </body>
</html>