Create Custom Vector Tiles
Code for the examples in this article can be found at https://github.com/kochis/us-constituency-vector-tiles
My previous post covers how vector tiles are used to create more dynamic and flexible maps. But vector tiles can also be useful to visualizing any type of geospatial data, particularly data that is too large or complex to be loaded all once.
Here I'll walk through creating and serving vector tiles from a custom GeoJSON dataset.
The Data
For this example, we'll be using the US Constituencies from Who's on First.
This dataset contains the congressional boundaries for every U.S. house and senate district, as well as state-level congressional boundaries.
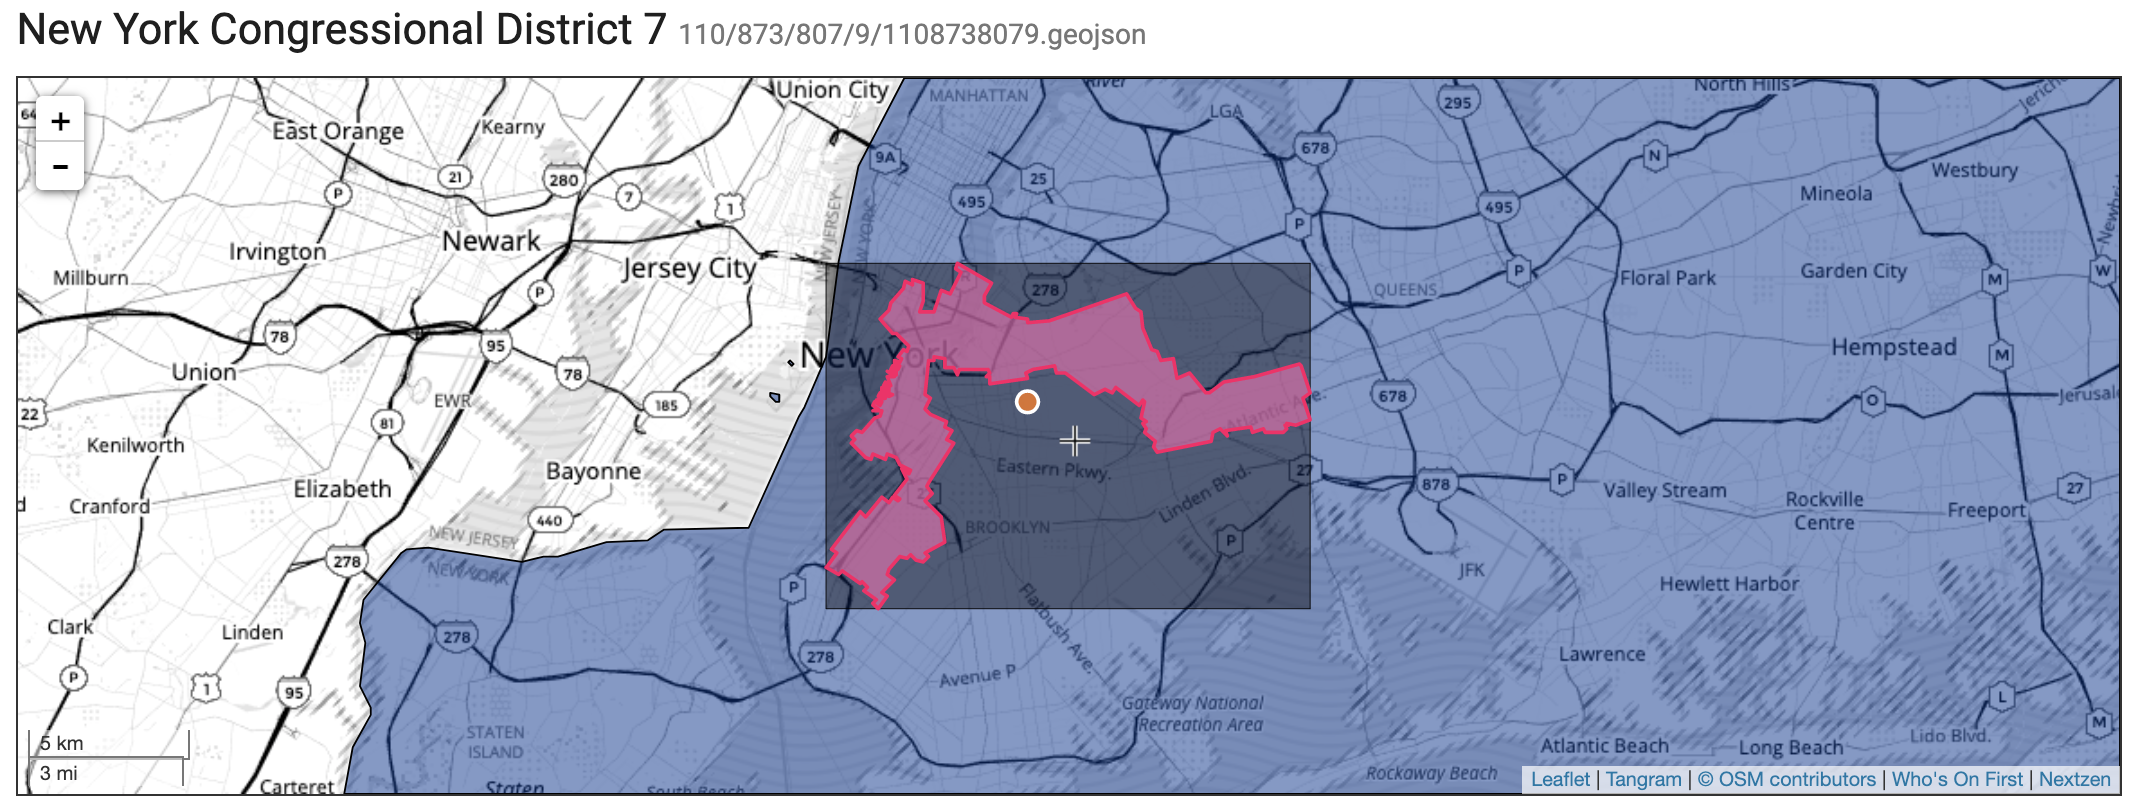
Who's On First congressional boundary for NY07
Build a GeoJSON Dataset
The folks at Geocode Earth graciously host the pre-built db files for every Who's On First repo. For this demo, we can grab the pre-built US Constituencies here: https://geocode.earth/data/whosonfirst (whosonfirst-data-constituency-us-latest.db.bz2)
The data is distributed as an SQLite database, with a few basic tables, but the only one we need here is geojson, which contains all the raw constituency records as a string in the body column.
$ sqlite3 whosonfirst-data-constituency-us-latest.db ".schema geojson"

CREATE TABLE geojson (
  id INTEGER NOT NULL,
  body TEXT,
  source TEXT,
  alt_label TEXT,
  is_alt BOOLEAN,
  lastmodified INTEGER
);
So we can dump all of the records into a line-delimited GeoJSON file.
$ sqlite3 whosonfirst-data-constituency-us-latest.db "select body from geojson" > constituencies.geojson
Which gives us our constituencies.geojson file, without about 7k records, and comes in at almost 600MB.
$ wc -l constituencies.geojson
  7338 constituencies.geojson
$ du -h constituencies.geojson
  586M constituencies.geojson
This dataset contains boundaries for 4 different constituencies: house districts (US & state) and senate districts (US & state). To make the visualization a bit cleaner, we can add some additional metadata for breaking our data up into layers. We'll use a small node script to add an additional property to each GeoJSON object.
1
2
3
4
5
6
7
8
9
10
11
12
13
14
15
16
17
18
19
20
21
22
const fs = require('fs');
const readline = require('readline');

const constituentciesWithLayers = [];

const start = async () => {
  const fileStream = fs.createReadStream('./constituencies.geojson');
  const reader = readline.createInterface({ input: fileStream });

  for await (const line of reader) {
    const json = JSON.parse(line);
    const type = json.properties['wof:association'];
    if (type) {
      json.tippecanoe = { "layer": type }; // add a "layer" field with the constituency type
      constituentciesWithLayers.push(JSON.stringify(json));
    }
  }

  fs.writeFileSync(`./constituencies-with-layers.geojson`, constituentciesWithLayers.join('\n'));
};

start();
Create a Tileset
Now that we have our data in GeoJSON format, we can use the program Tippecanoe to generate the vector tileset.
There are a lot of configuration options for Tippecanoe, so I wont go into too much detail here. What we'll do, is input our GeoJSON that has the layers, along with some config options, and the output will be an .mbtiles file.
# Generate mbtiles with the following options
# -z 10 (maxzoom 10)
# -Z 0 (minzoom 0)
# -r1 (dont drop points)
# -P (parallel process input file)
# -pf (no feature limit)
# -pk (no point limit)
# -f (force: allow override of existing file)
# -o (output file)
tippecanoe -z 10 -Z 0 -r1 -P -pf -pk -f -o "./us-constituencies.mbtiles" "./constituencies-with-layers.geojson"
MBTiles
It's probably worth mentioning the MBtiles Spec at this point.
An .mbtiles file is an efficient way to package up a set of tiles (vector or raster) that can be served to a mapping client. Tiles can be distributed as flat files, usuall with a directory structure of z/x/y, but it's a lot more manageable to use a single .mbtiles file.
The .mbtiles file is distributed as an SQLite database, so you can inspect the contents of it. For instance, we can see it contains all of the tiles we'd expect for rendering a map, keeping with the z/x/y format.
$ sqlite3 us-constituencies.mbtiles ".schema tiles"
  CREATE TABLE tiles (zoom_level integer, tile_column integer, tile_row integer, tile_data blob);
  CREATE UNIQUE INDEX tile_index on tiles (zoom_level, tile_column, tile_row);

$ sqlite3 us-constituencies.mbtiles "select count(*) from tiles"
  21981

$ sqlite3 us-constituencies.mbtiles "select * from tiles limit 5"
  0|0|0|
  1|1|1|
  1|0|0|
  1|0|1|
  2|3|2|
So rather than reading the tile data from disk, it can be queried from the db (eg. fetch blob from z/x/y). The .mbtiles file also contains additional metadata about what's in the tileset, including which layers are available.
$ sqlite3 us-constituencies.mbtiles "select value from metadata where name = 'json'" | jq .vector_layers
[{
  "id": "state-house",
  "description": "",
  "minzoom": 0,
  "maxzoom": 10,
  "fields": {
    "geom:area": "Number",
    "geom:area_square_m": "Number",
    "geom:bbox": "String",
    "geom:latitude": "Number",
    "geom:longitude": "Number",
    "iso:country": "String",
    "wof:name": "String",
  }
},
...
]
Serve Vector Tiles
Now that we have our .mbtiles file, we can build a server for distributing to the client.
We'll use the node-mbtiles package for reading the data from the tileset. We'll also add a route for handling the tile requests in the format z/x/y.
1
2
3
4
5
6
7
8
9
10
11
12
13
14
15
16
17
18
19
20
21
22
23
24
25
26
27
28
29
30
31
32
33
34
35
36
37
38
39
40
41
42
43
44
45
46
47
48
49
50
51
52
53
54
55
56
57
58
59
60
61
62
63
64
65
66
67
68
69
70
71
72
73
const path = require('path');
const express = require('express');
const MBTiles = require('@mapbox/mbtiles');

const mbtilesFile = path.resolve(process.cwd(), 'us-constituencies.mbtiles');

// load file
const tiles = new MBTiles(mbtilesFile, (err) => {
  if (err) {
    console.error(err);
    process.exit(1);
  }

  // load metadata about tileset
  tiles.getInfo((err, tileInfo) => {

    const app = express();

    // serve style for map
    app.get('/style.json', (req, res) => {
      res.header("Content-Type",'application/json');
      res.sendFile(path.join(__dirname, 'style.json'));
    });

    // TileJSON spec: https://github.com/mapbox/tilejson-spec
    // tells map url for loading tiles
    app.get('/v1.json', (req, res) => {
      const tileJSON = Object.assign({}, tileInfo);
      tileJSON.tiles = [`http://localhost:3000/{z}/{x}/{y}.pbf`];
      return res.json(tileJSON);
    });

    // handle tile requests in /z/x/y format
    app.get('/:z(\\d+)/:x(\\d+)/:y(\\d+).:format([\\w.]+)', (req, res) => {
      let { x, y, z } = req.params;

      // convert to int and truncate
      x = x | 0;
      y = y | 0;
      z = z | 0;

      // check if bounds are valid in tileset
      if (z < tileInfo.minzoom || x < 0 || y < 0 || z > tileInfo.maxzoom || x >= Math.pow(2, z) || y >= Math.pow(2, z)) {
        return res.status(404).send('Out of bounds');
      }

      // lookup tile in tileset
      tiles.getTile(z, x, y, (err, tileData, headers) => {
        if (err) {
          return res.status(500).send(err.message);
        }
        if (tileData == null) {
          return res.status(404).send('Not found');
        }

        headers['Content-Type'] = 'application/x-protobuf';
        headers['Content-Encoding'] = 'gzip';
        res.set(headers);

        res.status(200).send(tileData);
      });
    });

    app.get('/', (req, res) => {
      res.sendFile(path.join(__dirname, 'index.html'));
    });

    // start server
    app.listen(port, () => {
      console.log(`Server listening at http://localhost:3000`)
    });
  });
});
{
  "version": 8,
  "name": "Custom Vector Tiles",
  "metadata": {
    "custom-vector-tiles: version": "1.x"
  },
  "id": "us-constituencies",
  "sources": {
    "us-constituencies": {
      "type": "vector",
      "url": "http://localhost:3000/v1.json"
    }
  },
  "layers": [
    {
      "id": "state-senate-fill",
      "source": "us-constituencies",
      "source-layer": "state-senate",
      "type": "fill",
      "paint": {
        "fill-color": "#ff004c",
        "fill-opacity": 0.4
      }
    }
  ]
}
Render Tiles on a Map
With our vector tile server in place, we can now load these tiles on a map.
Using the most basic example from Mapbox we can make a few small adjustments to load the tiles from our server instead.
1
2
3
4
5
6
7
8
9
10
11
12
13
14
15
16
17
18
19
20
21
22
23
24
25
26
<!DOCTYPE html>
<html>
  <head>
    <meta charset="utf-8" />
    <title>Display a map</title>
    <meta name="viewport" content="initial-scale=1,maximum-scale=1,user-scalable=no" />
    <script src="https://api.mapbox.com/mapbox-gl-js/v1.12.0/mapbox-gl.js"></script>
    <link href="https://api.mapbox.com/mapbox-gl-js/v1.12.0/mapbox-gl.css" rel="stylesheet" />
    <style>
      body { margin: 0; padding: 0; }
      #map { position: absolute; top: 0; bottom: 0; width: 100%; }
    </style>
  </head>
  <body>
    <div id="map"></div>

    <script>
      var map = new mapboxgl.Map({
        container: 'map',
        style: 'http://localhost:3000/style.json', // load style from our server
        center: [-97.04129450036908, 38.08064523709163],
        zoom: 3.5
      });
    </script>
  </body>
</html>
If all is setup correctly, we should see a all the US state senate constituencies, rendered in an interactive map (can pan & zoom around)
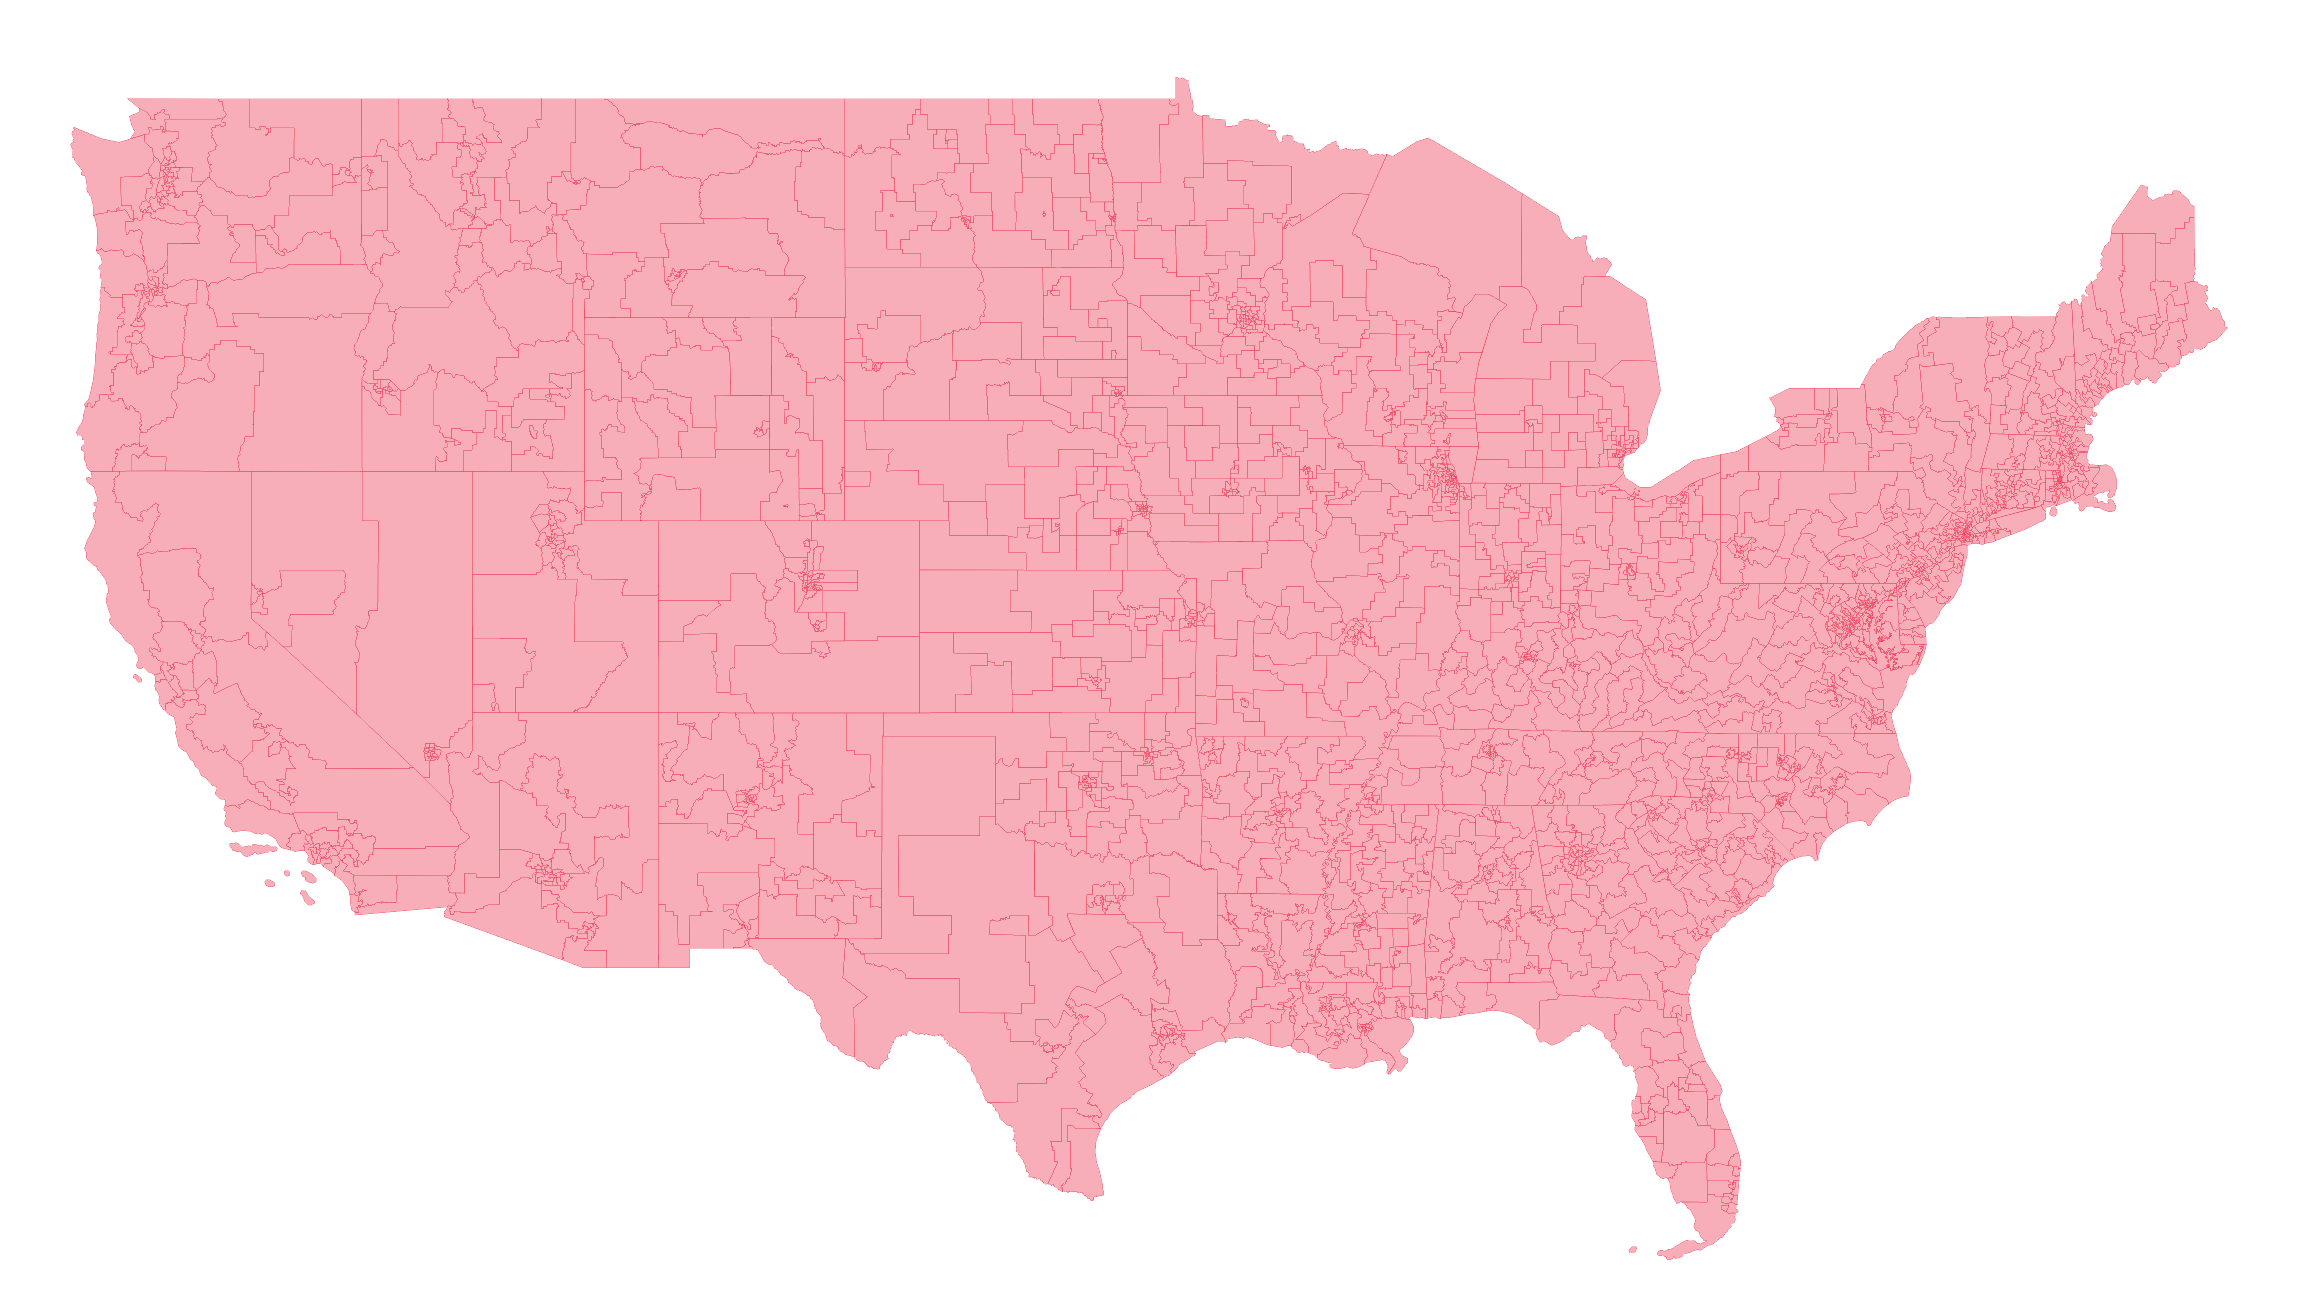
Right now, we're only seeing one of the four layers available in our data (state-senate). This is because our style configuration only has an entry for one layer.
{
  "layers": [
    {
      "id": "state-senate-fill",
      "source": "us-constituencies",
      "source-layer": "state-senate",
      "type": "fill",
      "paint": {
        "fill-color": "#ff004c",
        "fill-opacity": 0.4
      }
    }
  ]
}
If we want to see the other layers available, we'll need to update the layers property to include styles for our other layers. The nice thing about vector tiles, is we can do that only-the-fly on the client-side. See this demo for how to toggle layers by clicking on the layer in the legend.
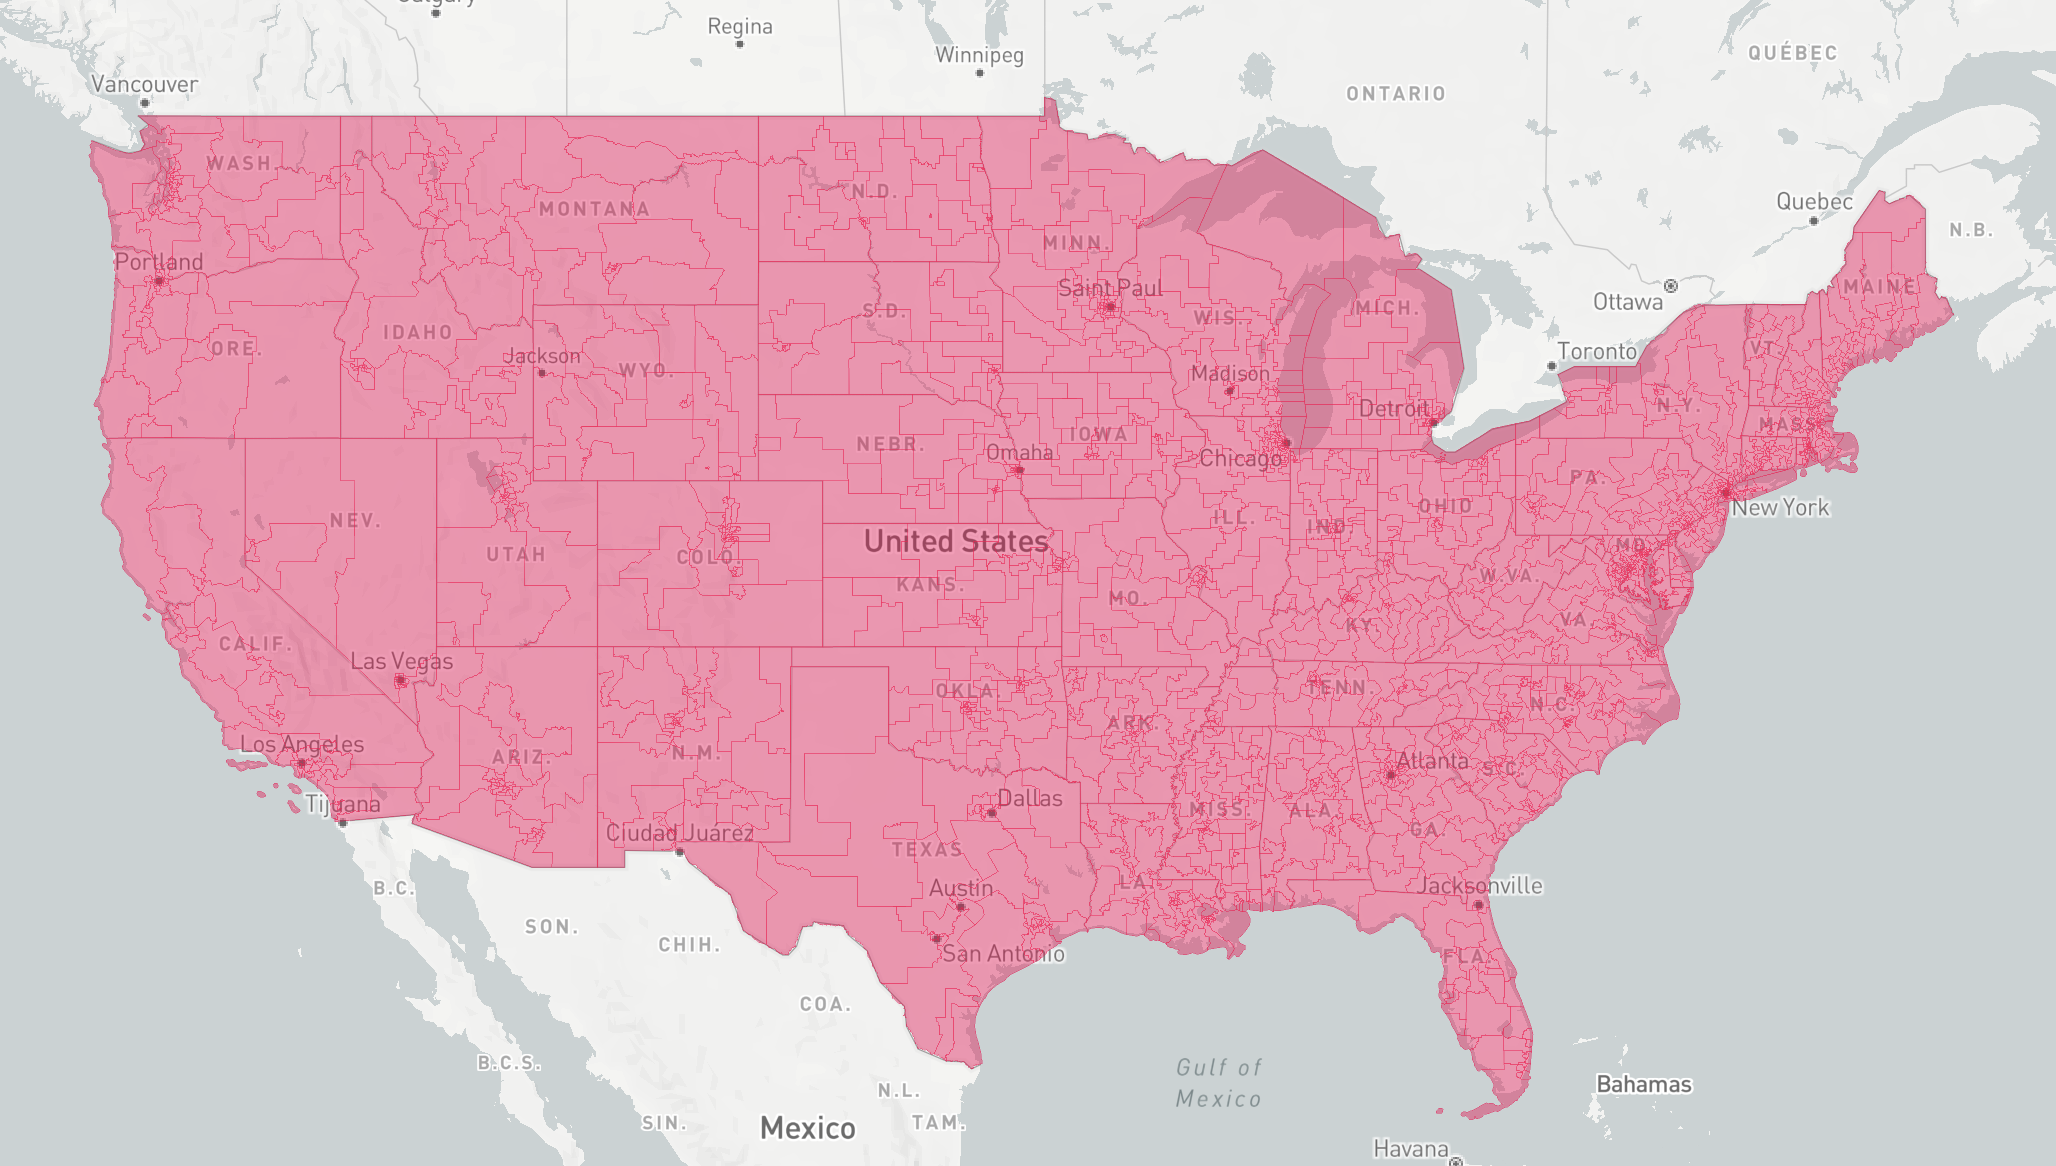
Use a Basemap
As of now, the only tileset being loaded are the vector tiles we created. More likely though, we'll want to overlay our custom data onto a a basemap.
We can do this by adding an additional vector source to our map. For this, we'll use the style source hosted by mapbox (this will require a Mapbox API token), then add our additional layer source.
1
2
3
4
5
6
7
8
9
10
11
12
13
14
15
16
17
18
19
20
21
22
23
24
25
26
27
28
29
30
mapboxgl.accessToken = 'MAPBOX_ACCESS_TOKEN';

// init mapbox lib using a mapbox hosted style
var map = new mapboxgl.Map({
  container: 'map', // container id
  style: 'mapbox://styles/mapbox/light-v10',
  center: [-97.04129450036908, 38.08064523709163], // starting position [lng, lat]
  zoom: 3.5 // starting zoom
});

map.on('load', function() {

  // once map loads, add our vector data as additional source
  map.addSource('us-constituencies', {
    type: 'vector',
    url: 'http://localhost:3000/style.json' // use our existing style config
  });

  // add an additional layer style for our vector data
  map.addLayer({
    "id": "state-senate-fill",
    "source": "us-constituencies",
    "source-layer": "state-senate",
    "type": "fill",
    "paint": {
      "fill-color": "#ff004c",
      "fill-opacity": 0.4
    }
  });
});
Our custom vector tiles will now be loaded alongside the Mapbox's tiles, and we can style our layers accordingly.
To find more complete and runnable code examples, see https://github.com/kochis/us-constituency-vector-tiles