Vector Tiles
Vector tiles are a dynamic and powerful way of displaying or visualizing any type of geospatial data. For the context of this article, I'll mostly be refering to Vector Tiles as covered in the Mapbox Vector Tile spec.
Why Vector Tiles
Historically, map tiles were served as pre-rendered images (known as raster tiles), with all of the styling and layer detail baked into the image. One advantage of this approach, is that all the possible tiles for every zoom level could be generated in advance. This lends it self well to a web context, where that data could be efficiently cached, and even served through a CDN. And since the data is just an image, there is very little client-side processing necessary, since browsers are just rendering images.
The downside however, is that any change to the display would require regenerating these images. For instance, the ability to toggle a layer like roads on / off, would require accessing an entirely different set of tiles. More sophisticated tile renderers can generate images on-the-fly, but it's still a costly overhead to re-generate images on-demand, as well as the sheer data size of transferring many images over the wire.
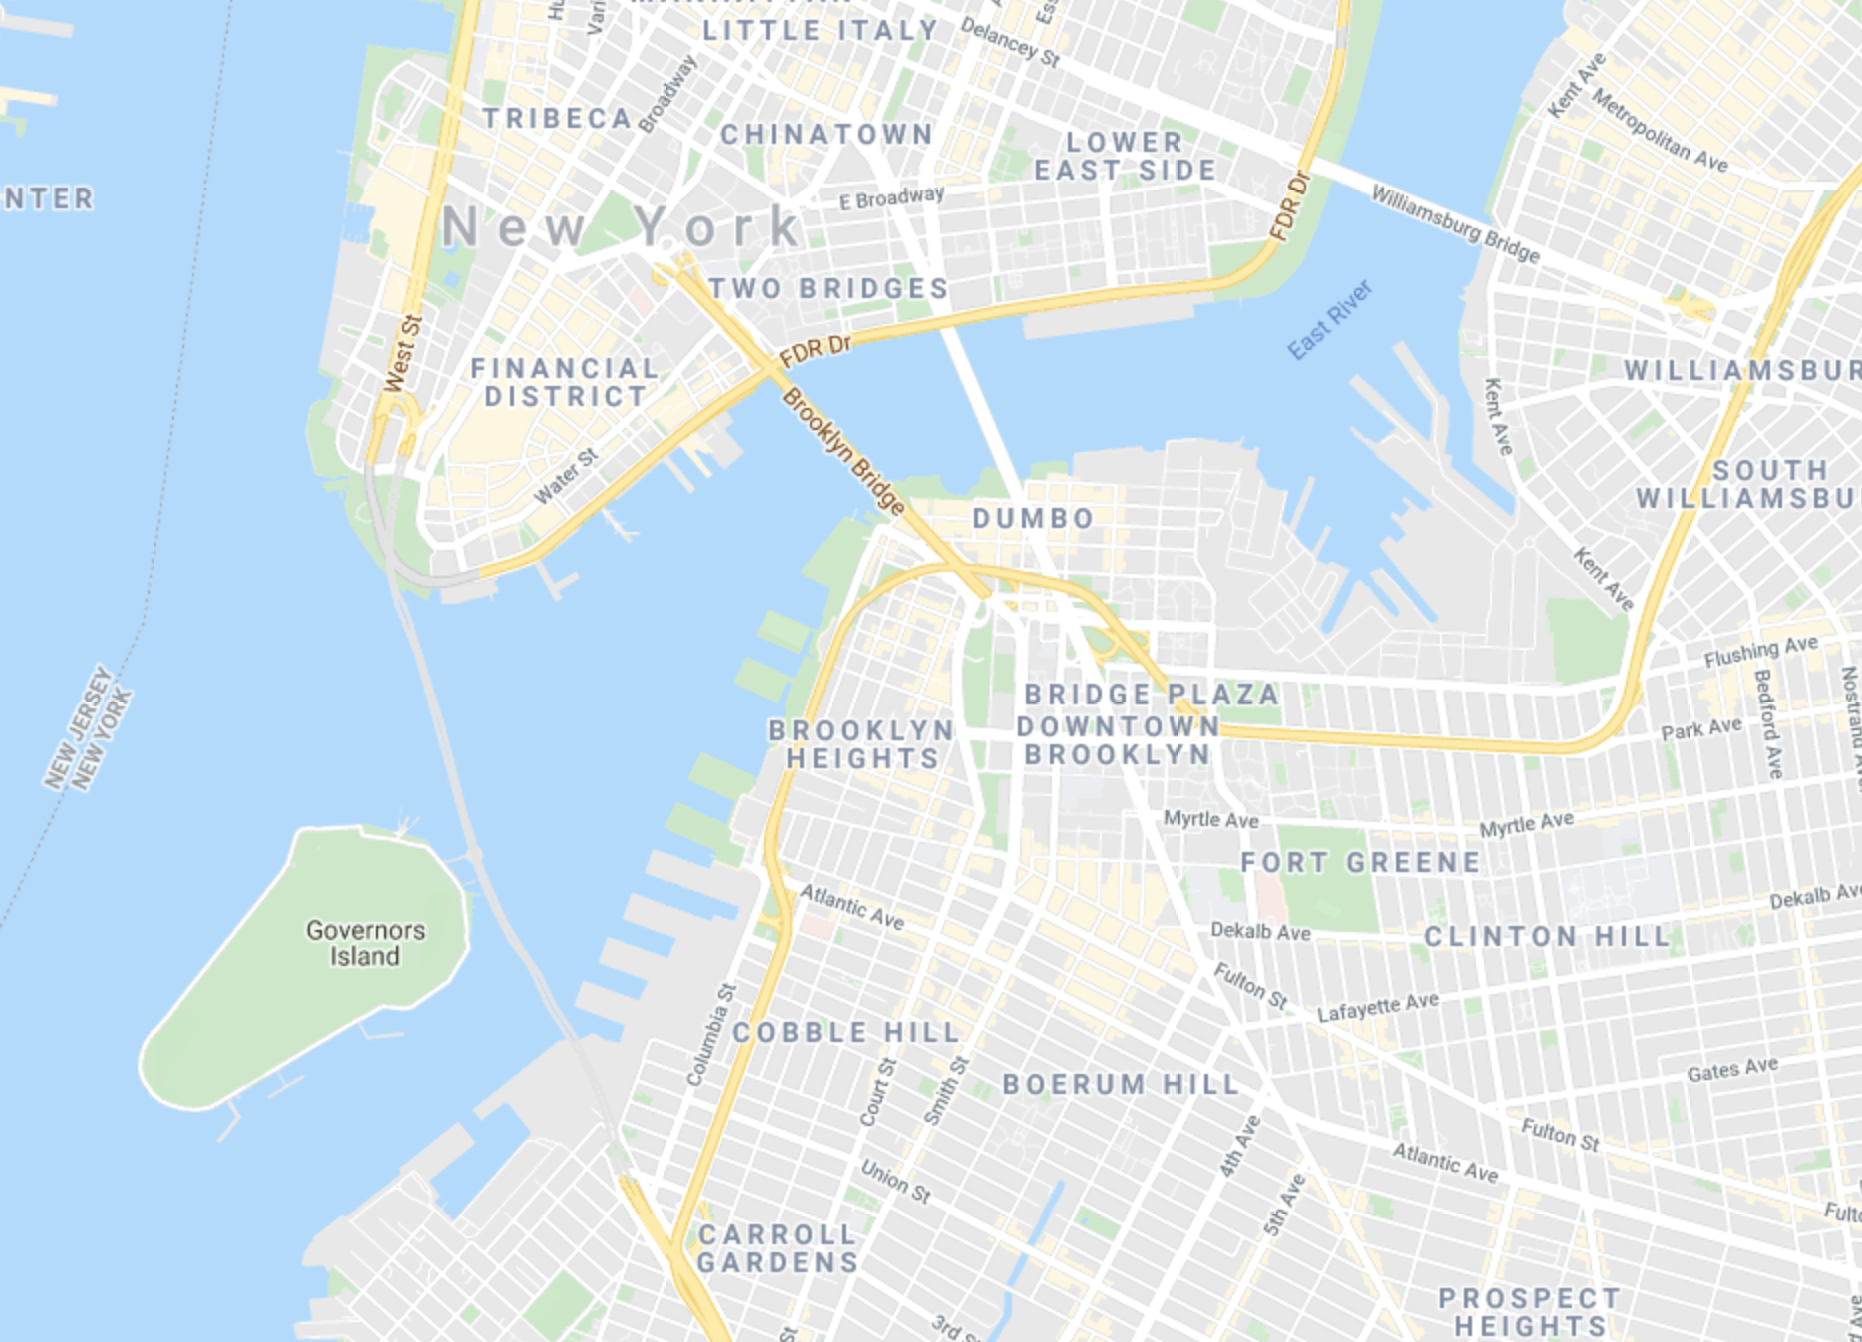
With raster tiles, visual changes require generating two separate images. One with roads, and one without.
Vector tiles still share the same concepts as raster tiles in terms of how the data is presented; layers are styled and drawn on top of each other. The real difference is when and where the rendering happens.
Rather than pre-rendering an image, all the available data for a tile is sent to the client. The raw vector data (geometries, points, layers, etc...) is separated from the presentation (how each layer is styled) and both are run through the rendering engine (in this case, Mapbox GL JS) to produce the output.
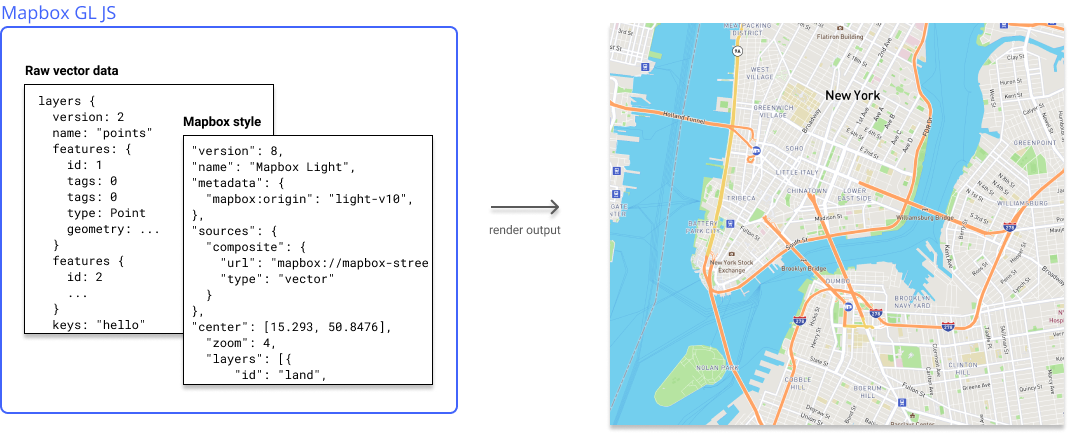
Vector tiles are generated by combining vector data with a style definition.
The result is a fully client-side customizable map, that also has a smoother experience by being able to render data on a continuous zoom level, rather than discreet levels you'd see with a raster map.
How it works
Let's take a look at the display a map example using Mapbox GL JS.
var map = new mapboxgl.Map({
  container: 'map', // container id
  style: 'mapbox://styles/mapbox/streets-v11', // style URL
  center: [-74.5, 40], // starting position [lng, lat]
  zoom: 9 // starting zoom
});
The line I'm mostly interested in is mapbox://styles/mapbox/streets-v11. This refers to the style object that will determine what the actual rendered map will look like.
Here's a condensed version of the Mapbox style being used (see full version)
{
  "version": 8,
  "name": "Mapbox Streets",
  "metadata": {
    "mapbox:type": "default",
    "mapbox:origin": "streets-v11",
    "mapbox:autocomposite": true,
  },
  "sources": {
    "composite": {
      "url": "mapbox://mapbox.mapbox-streets-v8,mapbox.mapbox-terrain-v2",
      "type": "vector"
    }
  },
  "center": [0, 0],
  "zoom": 3,
  "sprite": "mapbox://sprites/mapbox/streets-v11",
  "glyphs": "mapbox://fonts/mapbox/{fontstack}/{range}.pbf",
  "layers": [ ... ], // 111 items
  "visibility": "public",
  "created": "1970-01-01T00:00:00.000Z",
  "modified": "1970-01-01T00:00:00.000Z",
  "owner": "mapbox",
  "id": "streets-v11",
  "draft": false
}
The first thing to look at here is the sources. This is telling the client-side library where it's going to load the vector data from. In this case, it's using multiple data sources. If we were again to look at the source, we'll get another JSON object, this one in TileJSON format.
{
  "bounds": [-180, -85, 180, 85],
  "center": [0, 0, 0],
  "format": "pbf",
  "maxzoom": 16,
  "minzoom": 0,
  "name": "Mapbox Terrain V2 + Mapbox Streets v8",
  "scheme": "xyz",
  "tilejson": "2.2.0",
  "tiles": [
    "https://a.tiles.mapbox.com/v4/mapbox.mapbox-streets-v8,mapbox.mapbox-terrain-v2/{z}/{x}/{y}.vector.pbf",
  ],
  "vector_layers": [ ... ], // 11 items
}
This contains a bunch of meta information about the data available in the tileset, as well as how the data should be loaded from the server. In the tiles, we see the entry:
"https://a.tiles.mapbox.com/v4/mapbox.mapbox-streets-v8,mapbox.mapbox-terrain-v2/{z}/{x}/{y}.vector.pbf"This is the endpoint used to load data as someone moves around the map. The {z}/{x}/{y} correspond to the zoom level, and which tile coordinates are visible in the viewport. You can see api calls to this endpoint if you move the map with the network tab open.
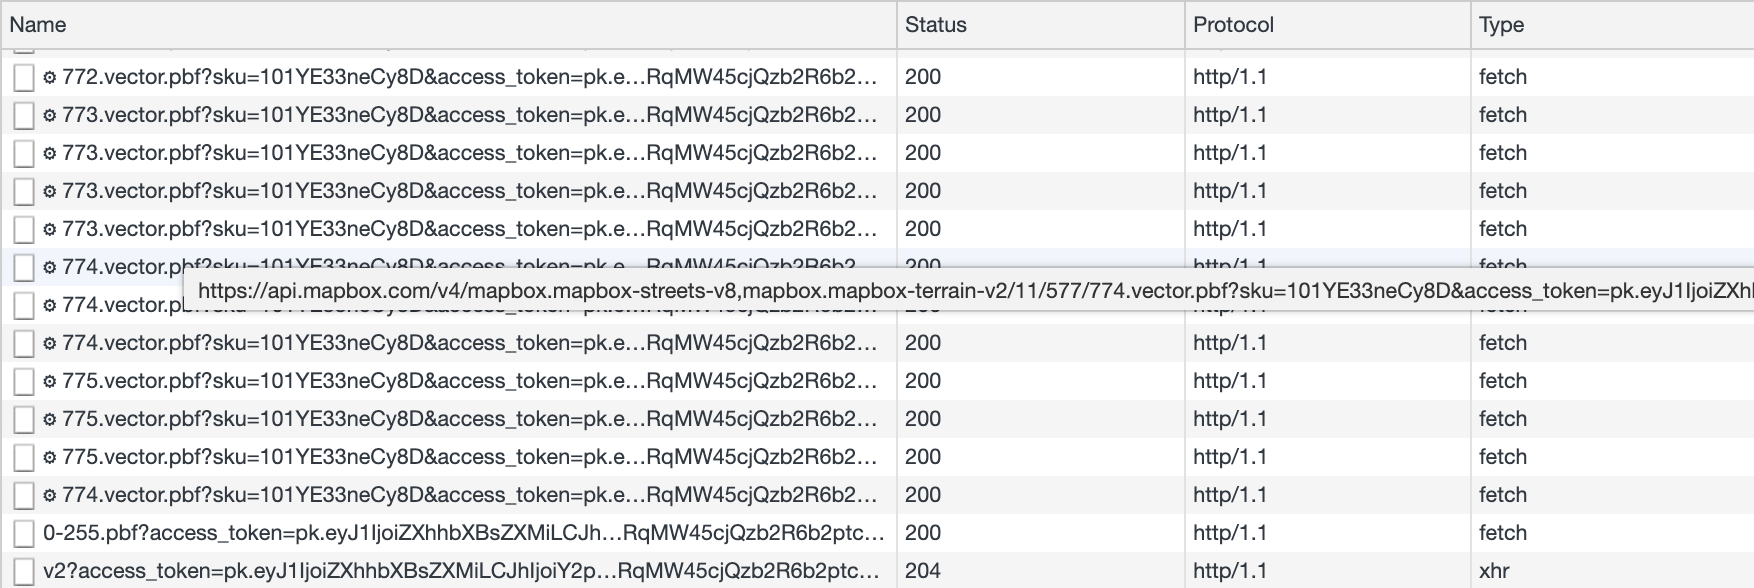
Data is feteched for each z/x/y position in the viewport.
You wont see much if you inspect the response, as the data is an encoded protobuf. But as mentioned earlier, once this raw data is combined with the style spec, the client-side library is able to render the map with the styles as the data streams in.
The last thing to mention here is layers. Both the style object, and TileJSON spec contain a field about layers.
// style spec
"layers": [
  {
    "id": "land",
    "type": "background",
    "paint": {
      "background-color": [
        "interpolate",
        ["linear"],
        ["zoom"],
        11,
        "hsl(35, 32%, 91%)",
      ]
    }
  },
  {
    "id": "landcover",
    "type": "fill",
    "source": "composite",
    "source-layer": "landcover",
    "maxzoom": 7,
    "paint": {
      "fill-color": [
        "snow",
        "hsl(0, 0%, 100%)",
        "hsl(75, 62%, 81%)"
      ]
    }
  }
]
// TileJSON spec
"vector_layers": [
{
"id": "landuse",
"description": "",
"fields": {
"class": "One of: agriculture, cemetery, glacier, grass, hospital, airport, park, parking, piste, pitch, rock, sand, school, scrub, wood, aboriginal_lands",
"type": "OSM tag, more specific than class"
},
"minzoom": 5,
"source": "mapbox.mapbox-streets-v8",
"source_name": "Mapbox Streets v8"
},
{
"id": "waterway",
"description": "",
"fields": {
"class": "One of: river, canal, stream, stream_intermittent, ditch, drain",
"iso_3166_1": "Text. The ISO 3166-1 alpha-2 code of the country/territory the feature is in.",
"iso_3166_2": "Text. The ISO 3166-2 code of the state/province/region the feature is in.",
"type": "One of: river, canal, stream, ditch, drain"
},
"minzoom": 7,
"source": "mapbox.mapbox-streets-v8",
"source_name": "Mapbox Streets v8"
},
...
]The style spec tells the renderer how each layer should look. Layers that are omitted from from the style spec, wont appear on the map, even if they are present in the data.
Are raster maps still relevant
While vector tiles are increasingly more common, there is still a place for using raster tiles. For one, vector tiles are a lot more resource intensive on the client-side, which could degrade the experience when working with really large datasets, or if a client doesn't have GPU support.
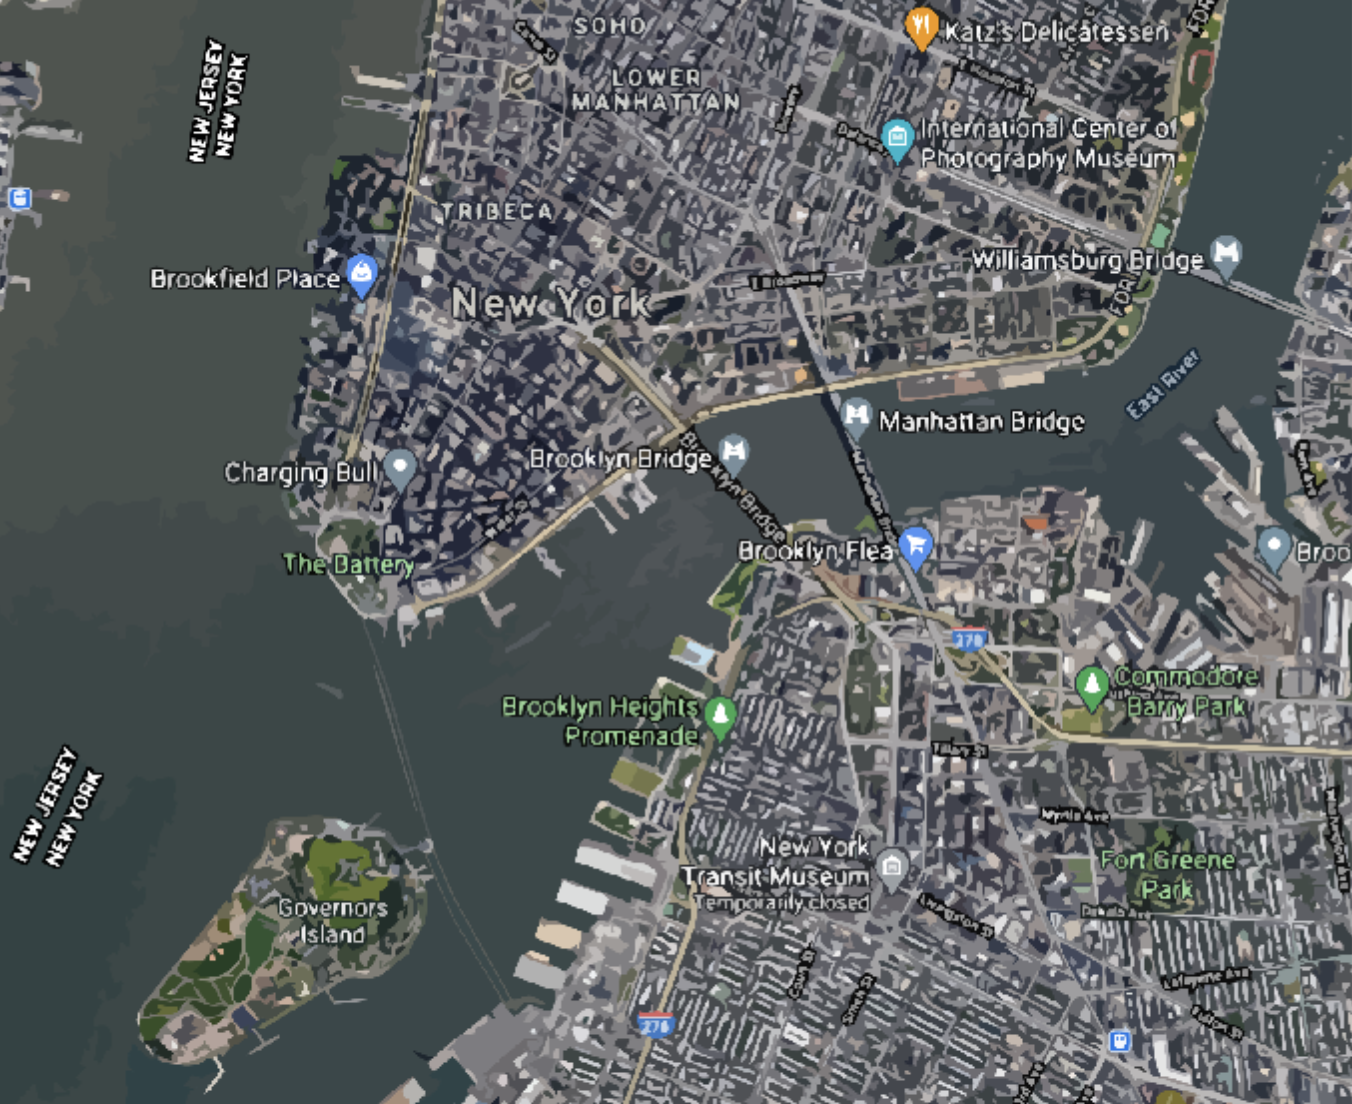
Also, vector drawing typically applies to shapes. There are cases where you actually want to using images. The most common example of this satellite imagery.
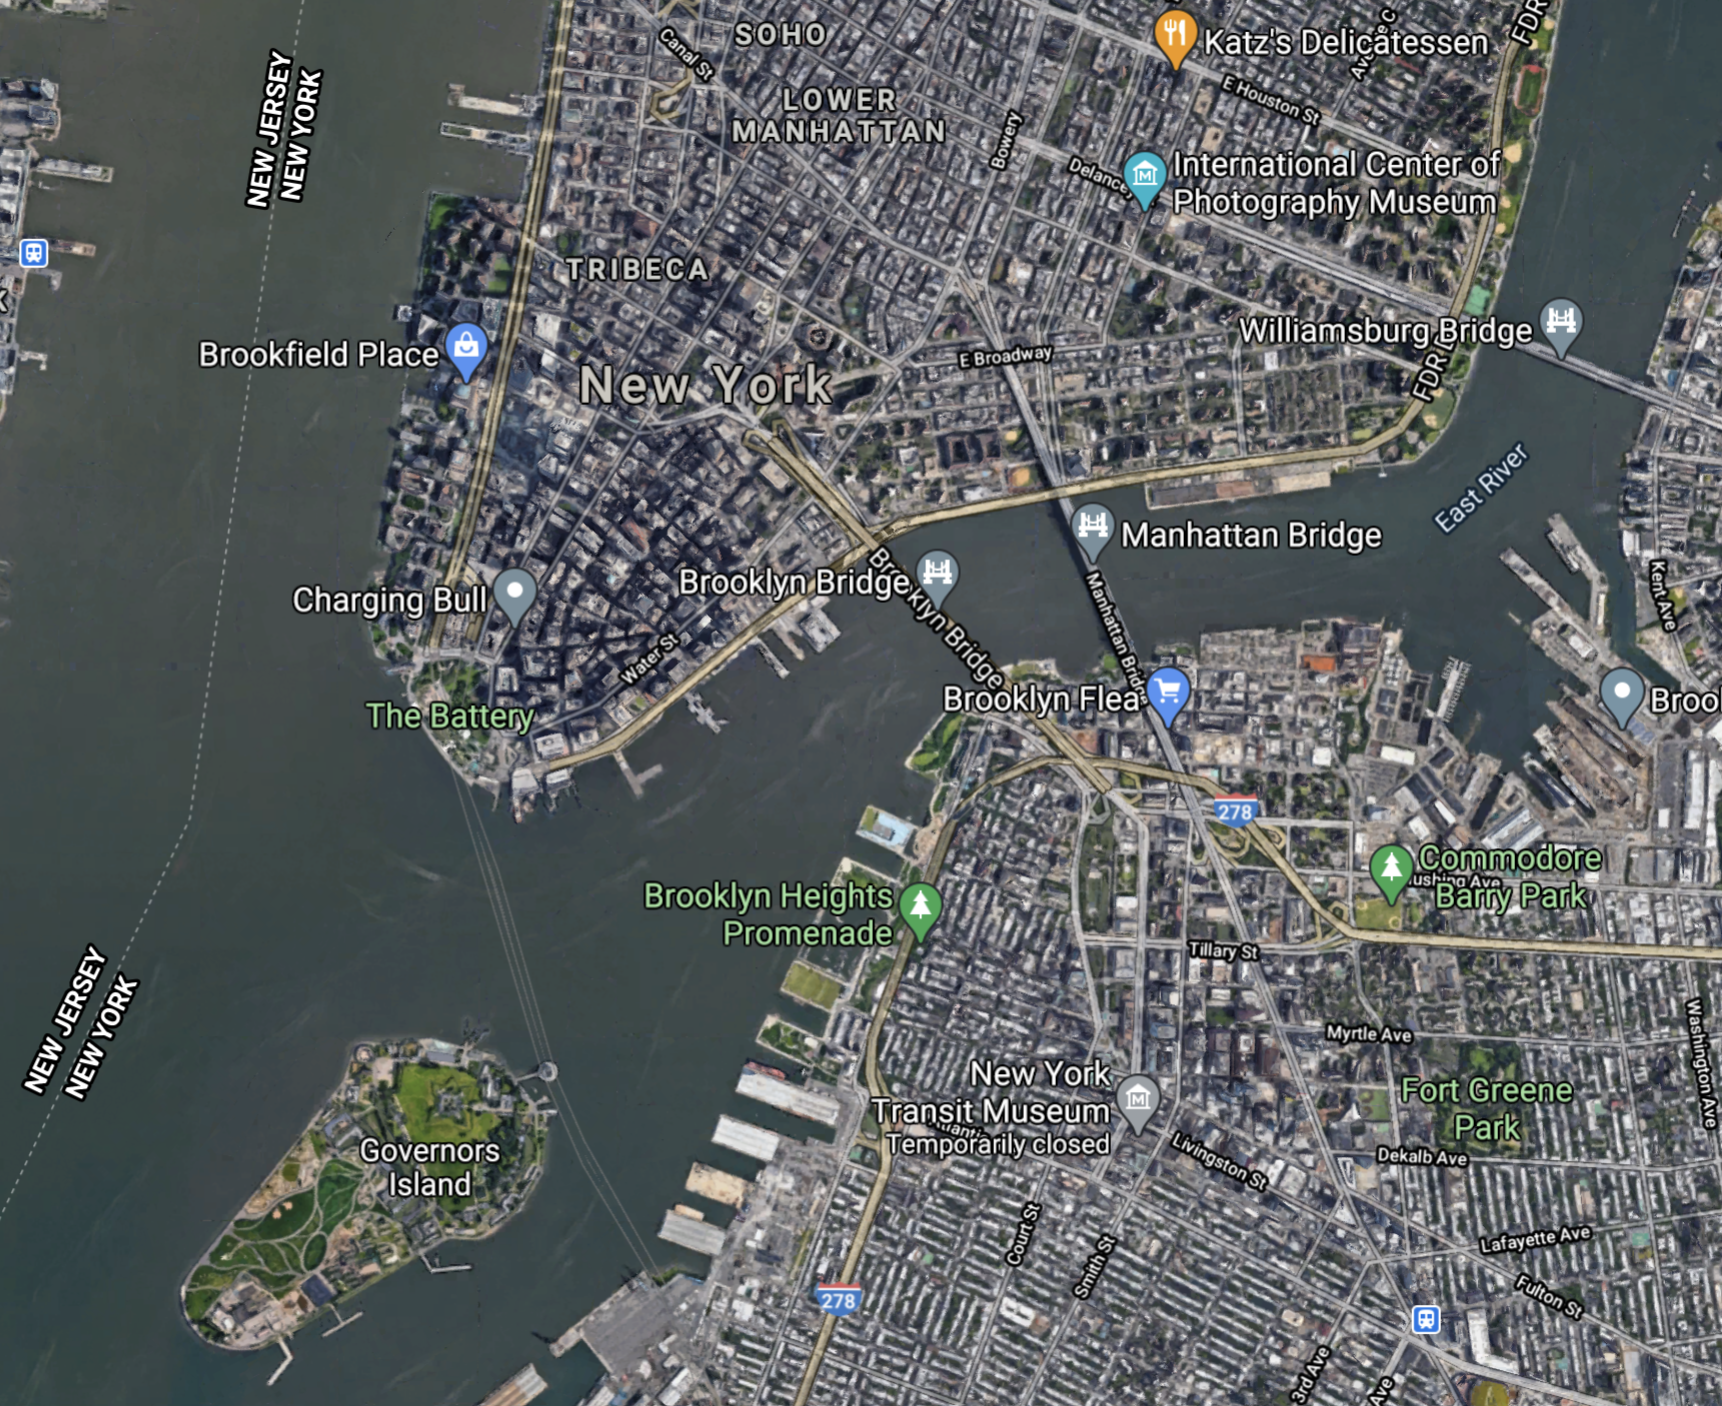
Satellite images are rendered as raster tiles.
Photorealistic images are much better represented by actual image formats (.png or .jpg), and actually more efficient in those case. You've probably seen this if you've ever tried to convert a raster image to a vector.
Raster image converted to vector.
It tends to not look very good, and actually requires a lot of resources for the CPU to render.
So while vector tiles are the new hotness in web maps, there's still a time and place for building maps the old fashioned way.