Deck GL Layers
In a previous article, we covered DeckGL Basics through examples that showcase how DeckGL can be used to overlay data on a map, and handle interactions.
But the real power of DeckGL comes through its use of Layers. While it does support the use of Custom Layers, this article will focus on some of the more common or interesting built-in layers.
Scatterplot
One of the most common uses of geospatial visualization is plotting a data point on the map, which can be done with the ScatterplotLayer. We covered this a bit in a previous article, so we won't go into too much detail here.
Using the NYC taxi trip data, we can plot all the pickup and drop-off locations by creating a new ScatterPlot layer from our data.
1
2
3
4
5
6
7
8
9
10
11
new ScatterplotLayer({
  id: 'scatterplot',
  data: '/data/taxi.json', // load data from server
  getPosition: d => d.position, // get lng,lat from each point
  getColor: d => [0, 188, 255],
  getRadius: d => 25,
  opacity: 0.9,
  pickable: false,
  radiusMinPixels: 0.25,
  radiusMaxPixels: 30,
})1
2
3
4
5
6
7
8
9
10
11
12
13
14
15
16
17
18
19
20
21
22
23
24
25
26
27
28
29
30
31
32
33
34
35
36
37
38
39
40
41
42
43
44
45
46
47
48
49
50
51
52
53
54
55
56
57
58
59
60
61
62
63
64
65
66
67
68
69
70
71
72
73
74
75
76
77
78
79
80
81
import React, { useState, useEffect } from 'react';
import DeckGL, { ScatterplotLayer } from 'deck.gl';
import { StaticMap } from 'react-map-gl';
const { assign } = Object;

import { isMobile } from '../util/mobile';
import config from '../config';

const mapStyle = 'mapbox://styles/mapbox/light-v9';
const mapboxApiAccessToken = config('mapboxApiAccessToken');

const initialStyle = {
  position: "relative",
  width: "100%",
  height: "600px",
  border: "1px solid black",
};

const mobileStyle = {
  height: "350px",
}

// Viewport settings
const initialViewState = {
  latitude: 40.74910387115668,
  longitude: -73.98158569335885,
  zoom: 11,
  minZoom: 5,
  maxZoom: 16,
  pitch: 0,
  bearing: 0,
};

const color = {
  pickup: [0, 188, 255],
  dropoff: [255, 0, 75],
};

const DeckGLLayersScatterplotMap = () => {
  const [style, setStyle] = useState(assign({}, initialStyle));
  const [viewState, setViewState] = useState(initialViewState);

  useEffect(() => {
    if (isMobile()) {
      setStyle(assign({}, initialStyle, mobileStyle))
    }
  }, []);

  const layers = [
    new ScatterplotLayer({
      id: 'scatterplot',
      data: '/data/taxi.json', // load data from server
      getPosition: d => d.position,
      getColor: d => color[d.type],
      getRadius: 25,
      opacity: 0.9,
      pickable: false,
      radiusMinPixels: 0.25,
      radiusMaxPixels: 30,
    }),
  ];

  return (
    <DeckGL
      viewState={viewState}
      layers={layers}
      style={style}
      getCursor={() => 'default'}
      onViewStateChange={
        (nextViewState) => {
          setViewState(nextViewState.viewState);
        }
      }
      controller
    >
      <StaticMap mapboxApiAccessToken={mapboxApiAccessToken} mapStyle={mapStyle} />
    </DeckGL>
  );
}

export default DeckGLLayersScatterplotMap;
Arc
Another common visualization is to show the connection between two points on a map. For this, DeckGL has the ArcLayer.
Using the same data as in the scatterplot (though slightly re-formatted), we can plot each pickup & drop-off as an arc. It's definitely a crowded visualization given all the data, but it still highlights some of the patterns. For instance, you can see clusters forming around the airports in the outer boroughs. Also note the that each arc has 2 colors, which transitions between the points.
1
2
3
4
5
6
7
8
9
10
11
new ArcLayer({
  id: 'arc',
  data: '/data/trips.json', // load data from server
  getSourcePosition: d => d.pickup, // pickup lat,lng
  getTargetPosition: d => d.dropoff, // dropoff lat,lng
  getWidth: () => 1,
  opacity: 0.9,
  pickable: false,
  getSourceColor: color.pickup,
  getTargetColor: color.dropoff,
})1
2
3
4
5
6
7
8
9
10
11
12
13
14
15
16
17
18
19
20
21
22
23
24
25
26
27
28
29
30
31
32
33
34
35
36
37
38
39
40
41
42
43
44
45
46
47
48
49
50
51
52
53
54
55
56
57
58
59
60
61
62
63
64
65
66
67
68
69
70
71
72
73
74
75
76
77
78
79
80
81
import React, { useState, useEffect } from 'react';
import DeckGL, { ArcLayer } from 'deck.gl';
import { StaticMap } from 'react-map-gl';
const { assign } = Object;

import { isMobile } from '../util/mobile';
import config from '../config';

const mapStyle = 'mapbox://styles/mapbox/light-v9';
const mapboxApiAccessToken = config('mapboxApiAccessToken');

const initialStyle = {
  position: "relative",
  width: "100%",
  height: "600px",
  border: "1px solid black",
};

const mobileStyle = {
  height: "350px",
}

// Viewport settings
const initialViewState = {
  latitude: 40.74910387115668,
  longitude: -73.98158569335885,
  zoom: 11,
  minZoom: 5,
  maxZoom: 16,
  pitch: 0,
  bearing: 0,
};

const color = {
  pickup: [0, 188, 255],
  dropoff: [255, 0, 75],
};

const DeckGLLayersArcMap = () => {
  const [style, setStyle] = useState(assign({}, initialStyle));
  const [viewState, setViewState] = useState(initialViewState);

  useEffect(() => {
    if (isMobile()) {
      setStyle(assign({}, initialStyle, mobileStyle))
    }
  }, []);

  const layers = [
    new ArcLayer({
      id: 'arc',
      data: '/data/trips.json', // load data from server
      getSourcePosition: d => d.pickup,
      getTargetPosition: d => d.dropoff,
      getWidth: () => 1,
      opacity: 0.9,
      pickable: false,
      getSourceColor: color.pickup,
      getTargetColor: color.dropoff,
    }),
  ];

  return (
    <DeckGL
      viewState={viewState}
      layers={layers}
      style={style}
      getCursor={() => 'default'}
      onViewStateChange={
        (nextViewState) => {
          setViewState(nextViewState.viewState);
        }
      }
      controller
    >
      <StaticMap mapboxApiAccessToken={mapboxApiAccessToken} mapStyle={mapStyle} />
    </DeckGL>
  );
}

export default DeckGLLayersArcMap;
GeoJSON
Another layer I wanted to cover here is the GeoJSON Layer, which can be used for overlaying any GeoJSON features on the map.
Using a simplified version of US Constituency boundaries, along with each constituency's party affiliation, we can plot each polygon on the map, and color it based on data from the properties field on our GeoJSON objects. This example also includes the getToolip used for displaying the constituency name on hover. The only requirement for using this function is setting pickable: true in the layer.
1
2
3
4
5
6
7
8
9
10
11
12
new GeoJsonLayer({
  id: 'constituencies',
  data: '/data/constituencies.json', // load data from server
  pickable: true,
  stroked: true,
  filled: true,
  lineWidthScale: 20,
  lineWidthMinPixels: 2,
  getFillColor: ({ properties }) => getColor(properties.PARTY_AFF, 'fill'),
  getLineColor: ({ properties }) => getColor(properties.PARTY_AFF, 'line'),
  getLineWidth: 2,
}),1
2
3
4
5
6
7
8
9
10
11
12
13
14
15
16
17
18
19
20
21
22
23
24
25
26
27
28
29
30
31
32
33
34
35
36
37
38
39
40
41
42
43
44
45
46
47
48
49
50
51
52
53
54
55
56
57
58
59
60
61
62
63
64
65
66
67
68
69
70
71
72
73
74
75
76
77
78
79
80
81
82
83
84
85
86
87
88
89
90
91
92
93
94
95
96
97
98
99
100
101
102
103
104
105
106
import React, { useState, useEffect } from 'react';
import DeckGL, { GeoJsonLayer } from 'deck.gl';
import { StaticMap } from 'react-map-gl';
const { assign } = Object;

import { isMobile } from '../util/mobile';
import config from '../config';

const mapStyle = 'mapbox://styles/mapbox/light-v9';
const mapboxApiAccessToken = config('mapboxApiAccessToken');

const initialStyle = {
  position: "relative",
  width: "100%",
  height: "600px",
  border: "1px solid black",
};

const mobileStyle = {
  height: "350px",
}

// Viewport settings
const initialViewState = {
  latitude: 38.70030850120041,
  longitude: -95.85543765467682,
  zoom: 3.5,
  minZoom: 2,
  maxZoom: 14,
  pitch: 0,
  bearing: 0,
};

const mobileViewState = {
  latitude: 40.2058252935211,
  longitude: -95.8814635880346,
  zoom: 2.3939577510276644,
};

const getColor = (party, type) => {
  const alpha = type == 'fill' ? 100 : 255;
  if (party === 'Democrat') {
    return [0, 188, 255, alpha];
  }
  if (party === 'Republican') {
    return [255, 0, 75, alpha];
  }
  return [160, 160, 180, alpha];
}

const tooltip = ({ object }) => {
  if (!object) {
    return;
  }

  const { STATE, CONG_DIST } = object.properties || {};
  const content = `${STATE} ${CONG_DIST}`.trim();
  return content || null;
};

const DeckGLLayersGeoJsonMap = () => {
  const [style, setStyle] = useState(assign({}, initialStyle));
  const [viewState, setViewState] = useState(initialViewState);

  useEffect(() => {
    if (isMobile()) {
      setStyle(assign({}, initialStyle, mobileStyle))
      setViewState(assign({}, initialViewState, mobileViewState))
    }
  }, []);

  const layers = [
    new GeoJsonLayer({
      id: 'constituencies',
      data: '/data/constituencies.json', // load data from server
      pickable: true,
      stroked: true,
      filled: true,
      lineWidthScale: 20,
      lineWidthMinPixels: 2,
      getFillColor: ({ properties }) => getColor(properties.PARTY_AFF, 'fill'),
      getLineColor: ({ properties }) => getColor(properties.PARTY_AFF, 'line'),
      getLineWidth: 2,
    }),
  ];

  return (
    <DeckGL
      viewState={viewState}
      layers={layers}
      style={style}
      getCursor={() => 'default'}
      getTooltip={tooltip}
      onViewStateChange={
        (nextViewState) => {
          setViewState(nextViewState.viewState);
        }
      }
      controller
    >
      <StaticMap mapboxApiAccessToken={mapboxApiAccessToken} mapStyle={mapStyle} />
    </DeckGL>
  );
}

export default DeckGLLayersGeoJsonMap;
Mapbox Vector Tile (MVTLayer)
The previous example shows how to load arbitrary GeoJSON onto the map, but if dealing with a much larger or complex data set, it may make sense to use the Vector Tile Layer. In a previous post, I go over creating custom vector tiles which I'll be using in this example.
Looking back at the GeoJSON Layer example above, while the geometry represents a good amount of data (~15K points, 0.6 MB) there is still a certain loss of precision once you zoom into the lower levels.
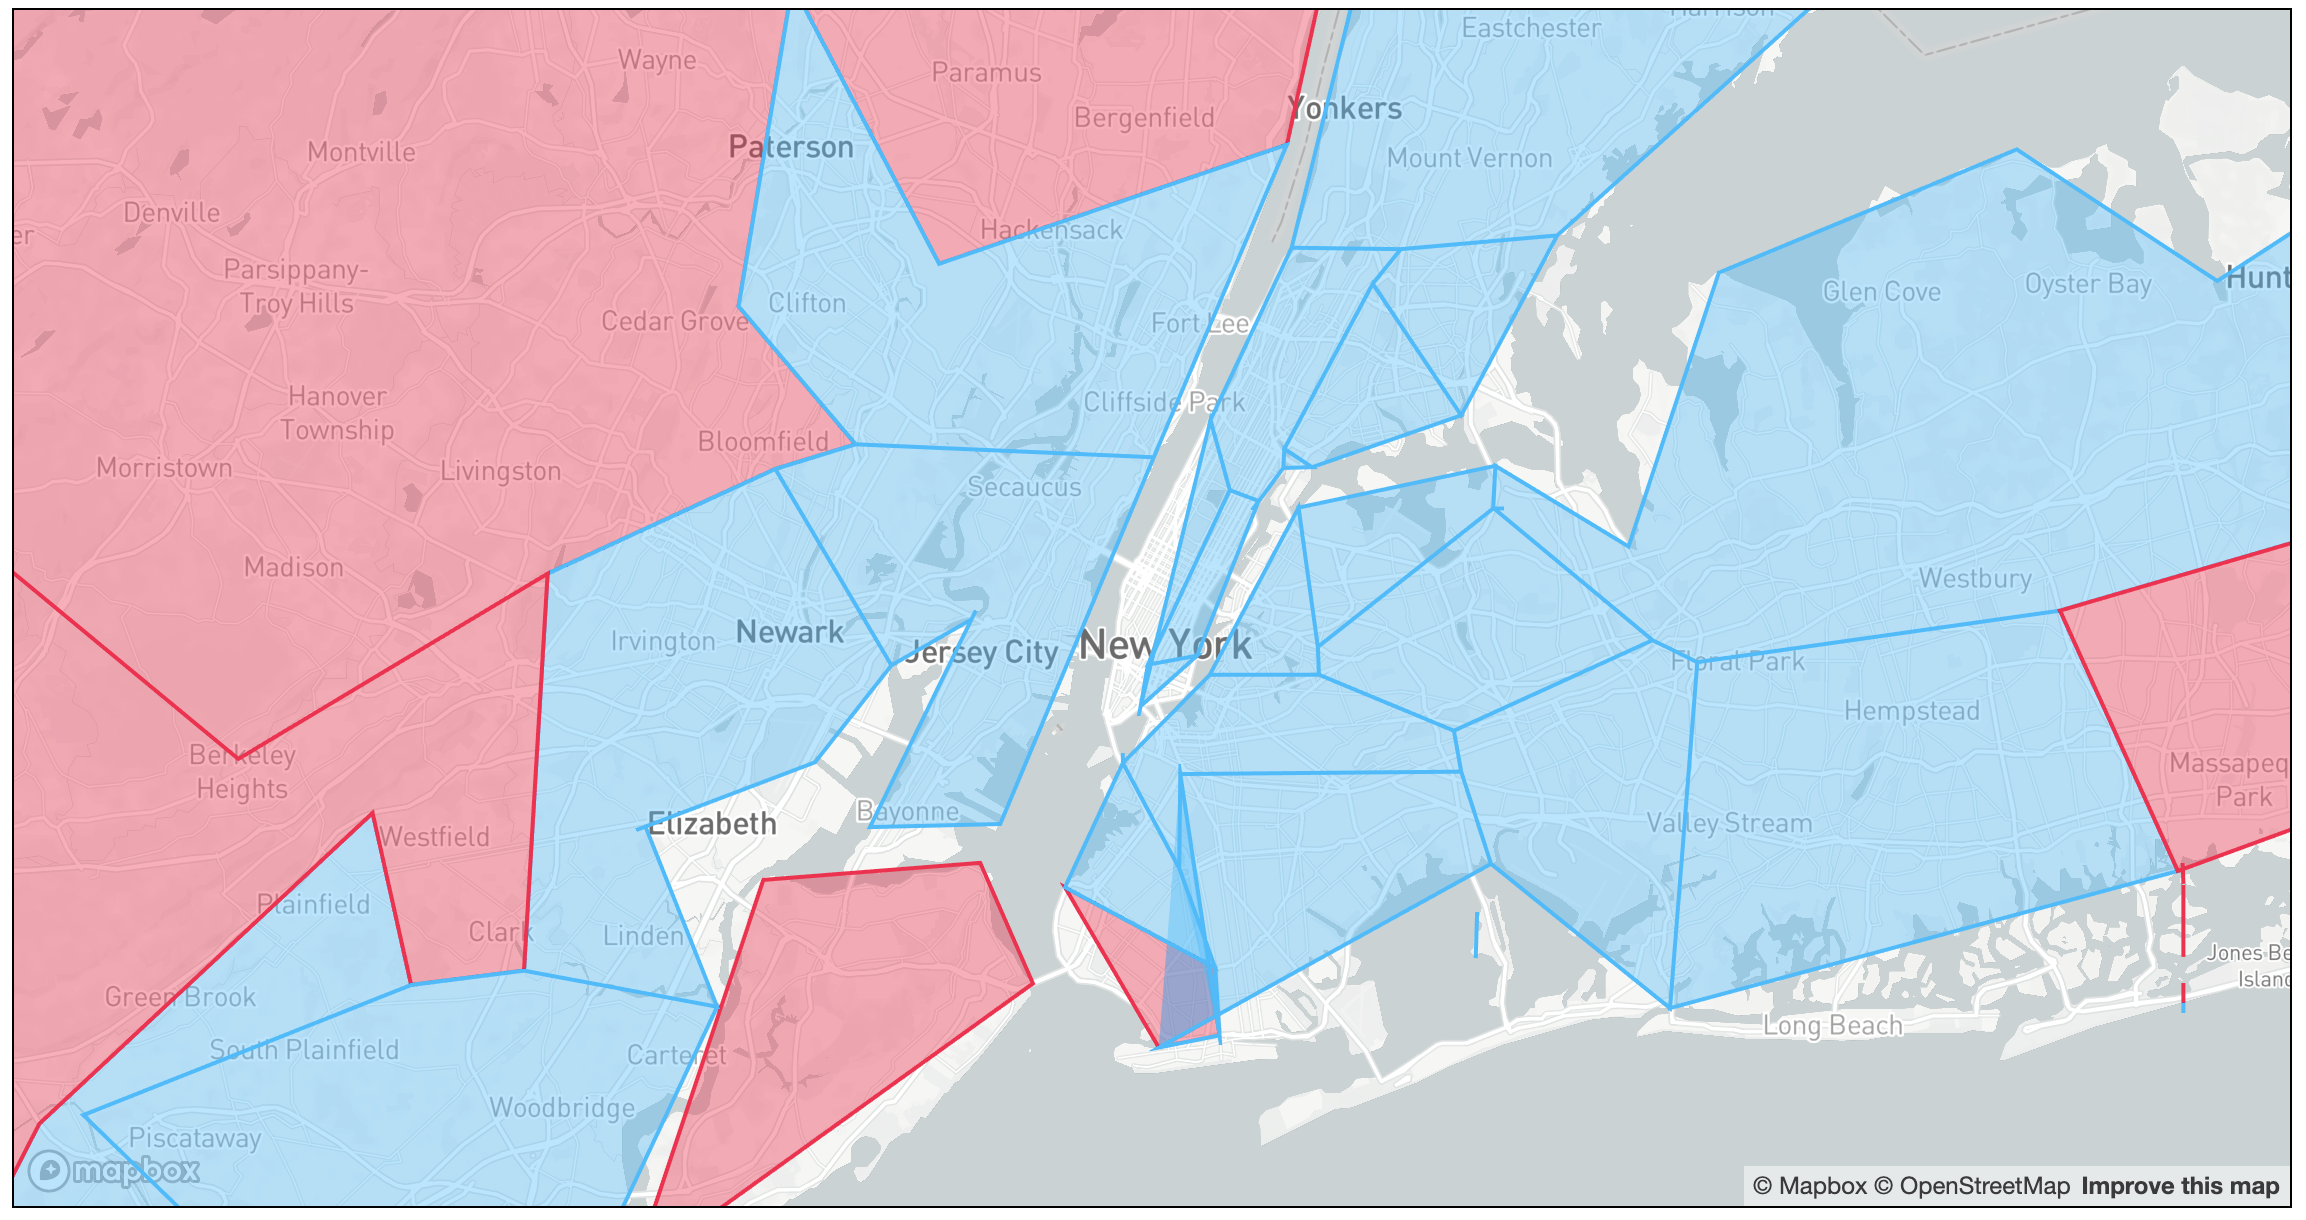
Precision loss when zooming in on GeoJSON example
One other constraint with GeoJSON is the same data is displayed at every zoom level. If we use the MVTLayer, we can selectively load data based on the visible map area and zoom level. This is why it allows for larger, and more dynamic data to be used. In this example, the US Constituency data consists of ~27M points, and is roughly 600 MB.
1
2
3
4
5
6
7
new MVTLayer({
  id: 'us-constituency-vector',
  data: tileServerUrl, // us-constituencies/{z}/{x}/{y}.pbf
  getFillColor: ({ properties }) => getColor(properties.layerName, 'fill'),
  getLineColor: ({ properties }) => getColor(properties.layerName, 'line'),
  lineWidthMinPixels: 2,
}),1
2
3
4
5
6
7
8
9
10
11
12
13
14
15
16
17
18
19
20
21
22
23
24
25
26
27
28
29
30
31
32
33
34
35
36
37
38
39
40
41
42
43
44
45
46
47
48
49
50
51
52
53
54
55
56
57
58
59
60
61
62
63
64
65
66
67
68
69
70
71
72
73
74
75
76
77
78
79
80
81
82
83
84
85
86
87
88
import React, { useState, useEffect } from 'react';
import DeckGL, { MVTLayer } from 'deck.gl';
import { StaticMap } from 'react-map-gl';
const { assign } = Object;

import { isMobile } from '../util/mobile';
import config from '../config';

const mapStyle = 'mapbox://styles/mapbox/light-v9';
const mapboxApiAccessToken = config('mapboxApiAccessToken');
const tileServerUrl = config('constituencyTileUrl');

const initialStyle = {
  position: "relative",
  width: "100%",
  height: "600px",
  border: "1px solid black",
};

const mobileStyle = {
  height: "350px",
}

// Viewport settings
const initialViewState = {
  latitude: 38.70030850120041,
  longitude: -95.85543765467682,
  zoom: 3.5,
  minZoom: 2,
  maxZoom: 10,
  pitch: 0,
  bearing: 0,
};

const mobileViewState = {
  latitude: 40.2058252935211,
  longitude: -95.8814635880346,
  zoom: 2.3939577510276644,
};

const VISIBLE_LAYER = 'us-house';

const getColor = (layer, alpha) => {
  if (layer === VISIBLE_LAYER) {
    return [0, 187, 255, alpha]
  }
  return [0, 0, 0, 0]; // filter out other layers
};

const DeckGLLayersMVTMap = () => {
  const [style, setStyle] = useState(assign({}, initialStyle));
  const [viewState, setViewState] = useState(initialViewState);

  useEffect(() => {
    if (isMobile()) {
      setStyle(assign({}, initialStyle, mobileStyle))
      setViewState(assign({}, initialViewState, mobileViewState))
    }
  }, []);

  const layers = [
    new MVTLayer({
      id: 'us-constituency-vector',
      data: tileServerUrl, // us-constituencies/{z}/{x}/{y}.pbf
      getFillColor: ({ properties }) => getColor(properties.layerName, 100),
      getLineColor: ({ properties }) => getColor(properties.layerName, 255),
      lineWidthMinPixels: 2,
    }),
  ];

  return (
    <DeckGL
      controller
      viewState={viewState}
      layers={layers}
      style={style}
      onViewStateChange={
        (nextViewState) => {
          setViewState(nextViewState.viewState);
        }
      }
    >
      <StaticMap mapboxApiAccessToken={mapboxApiAccessToken} mapStyle={mapStyle} />
    </DeckGL>
  );
}

export default DeckGLLayersMVTMap;
(There are some drawing artifacts, which might be part of DeckGL's vector drawing when buffering additional layers)